Time and Frequency Representations Overview
In this experiment you learn about three representations of discrete-time
signals. The first one is the standard time representation where the values
of a sequence are plotted against time instants. The second
representation is the
spectrum of a sequence. This is taken to be to the logarithmic
plot of the magnitude of the DFT of the sequence (the plot is normalized
to have a maximum at 0 dB). The spectrum provides information about the
frequency content of the sequence. The third representation is the spectrogram
of a sequence. It provides information about how the frequency content
of the sequence changes with time; it is a plot of frequency against
time with color used to indicate the relative strengths of the varied frequency
components (warm colors indicate high amplitudes).
The experiment allows the user to choose from a selection of sounds:
1) Bird chirps
2) Dropping egg
3) Train whistle
4) Beats
5) FM
All sequences have been obtained by sampling the original continuous-time
signal at 8192Hz.
For each choice of sound, the user can plot the time sequence, its
spectrum, or its spectrogram.
Here is an example.
-
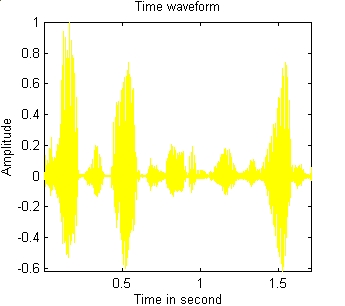
This is a time representation of a sentence. You can listen
to it.
-
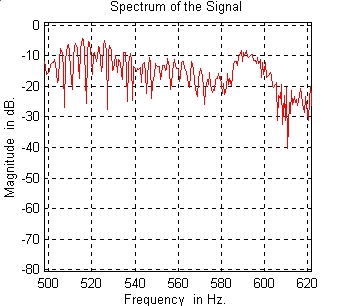
This is a portion of the spectrum of the above speech signal between 500
and 620 Hz.
-
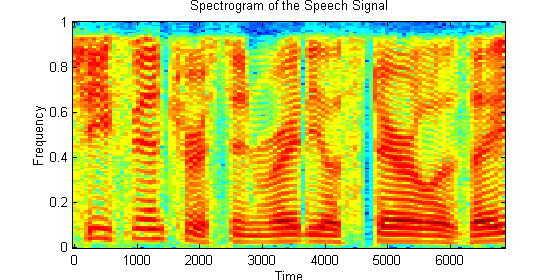
This is a plot of a typical the spectrogram of a speech signal. The spectrogram
is a plot of the frequency content of the signal as a function of time.
It is determined by computing the spectra of successive subintervals of
the sequence and by plotting their magnitude using a color code. You can
listen to the speech signal whose spectrogram
is shown below.