Modeling auditory perception to improve robust speech recognition
B. Strope and A. Alwan
Abstract
While non-stationary stochastic techniques have led to substantial improvements in vocabulary size and speaker independence, most automatic speech recognition (ASR) systems remain overly sensitive to the acoustic environment, precluding robust widespread applications. Our approach to this problem has been to model fundamental aspects of auditory perception, which are typically neglected in common ASR front ends, to derive a more robust and phonetically relevant parameterization of speech. Short-term adaptation and recovery, a sensitivity to local spectral peaks, together with an explicit parameterization of the position and motion of local spectral peaks reduces the error rate of a word recognition task by as much as a factor of 4. Current work also investigates the perceptual significance of pitch-rate amplitude-modulation cues in noise.
Introduction
Most modern speech recognition systems include an initial signal processing front end which converts the (1-D) speech waveform into a sequence of time-varying feature vectors, and a statistical pattern-comparison stage which chooses the most probable phoneme, syllable, word, phrase, or even sentence, given that sequence of feature vectors [1].
In the front end, the speech signal is typically divided in time into nearly-stationary overlapping (10-30 ms) frames. Short-time spectral estimations of each consecutive frame form the sequences of time-varying feature vectors analyzed by the pattern matching stage. One common form of spectral estimation involves integrating an initial power spectrum estimate which is weighted by bandpass-filter functions whose bandwidths approximate those of auditory filters. The magnitude of the power estimates from each filter are then compressed using a logarithmic function. The resulting spectral estimates reflect two of the most studied aspects of auditory signal processing: frequency selectivity, and magnitude compression.
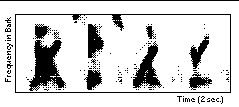
In Figure 1, sequences of spectral estimates are displayed as a spectrogram. The spectral estimate for each frame can be roughly decorrelated (across filter number) using a discrete cosine transform (DCT). After the DCT, the resulting cepstral vectors, called Mel-frequency cepstral coefficients (MFCC), are efficient representations of the Mel-warped log-magnitude power-spectrum.
Hidden Markov models (HMM) provide a generalized statistical characterization of the non-stationary stochastic process represented by the sequences of feature vectors. Each element of the vocabulary (word, syllable, or phone) is modeled as a Markov process with a small number of states. The model is hidden in the sense that the observed sequence of feature vectors does not directly correspond to the current model state. Instead, the model state specifies the statistics of the observed feature vectors. State transitions are often limited so that the model can either stay in its current state or move forward to the next. In this way, each state is used to characterize statistics for a particular temporal segment of the vocabulary element. In word-based recognition, the first state might characterize the beginning of the word, and the last state might characterize the end, etc.
For a continuous-density HMM, multi-variate distributions of the feature vector, and the state-transition probabilities are estimated for each state. An efficient iterative process (the forward/backward algorithm) is used to increase the likelihood of the current model, given a training set of exemplars corresponding to that model.
Although the number of possible state sequences grows exponentially with the number of frames in the exemplar, all possible paths must merge into the small number of states at each point in time. Because of the assumed first-order Markov structure, observation probabilities and state transitions are only a function of the current state, and not the path taken to get there. Therefore, the partial forward probabilities of observing the first N frames of the exemplar and ending at a specific state can be inductively computed from the N-1 forward probabilities. A similar iterative process is used to obtain backward probabilities of observing the last M frames.
Combining the forward and backward probabilities provides an estimate for the probability of making each state transition while observing each frame, given the entire exemplar. By averaging across all exemplars in the training set, new estimates for the state-transition probabilities are obtained. Similarly, parameters of the distributions (means and covariances of the feature vectors for each state) are estimated by weighting the observed feature vectors by the probabilities of having been at that state during the time of that feature vector.
Recognition performance is, therefore, largely dependent on a good statistical match between the test and training feature-vector sequences. Because most systems use short-time spectral estimates, distortions introduced by additive noise, or by a mis-match between the training and testing channels, considerably degrade recognition performance. One general approach to this problem is to find a parametric adjustment of the multi-variate distributions given the current acoustic environment [e.g. 2]. A more pragmatic approach is simply to train the models in an environment that is a reasonable match to the expected testing environment.
In the current paper three general approaches are used: 1) the front-end signal processing is augmented to include short-term adaptation and a sensitivity to local spectral peaks; 2) the frequency position and motion of the local spectral peaks are explicitly tracked and then parameterized by the HMM; and 3) two sets of models are used in parallel: one characterizing clean training data and the other characterizing noisy training data. The first two approaches attempt to focus the recognition task on phonetically relevant aspects of the sequences of short-time spectral estimates, while the third technique provides some adaptation of the statistical characterization for the expected acoustic environment.
Adaptation
The firing patterns of auditory neurons show clear evidence of adaptation [3]. In response to a long-duration tone pulse, a single neuron provides a strong onset response which then decays with time to a weaker steady-state response. After the offset of a tone pulse, the neural response initially drops below its resting rate, and then slowly recovers. While the neuron is still recovering, the onset response to a similar second pulse will be weaker than it was to the first. The decaying response after onset is often called adaptation, and the increasing response after offset is called recovery. Adaptation and recovery are measured throughout the nervous system at a wide variety of rates, but recovery is often 3-4 times slower than adaptation [4]. For this work we focus on the adaptation and recovery which are significant at phonemic and syllabic rates (10-200 ms). Figure 2 shows a simulated response to two identical pulses. Notice the weaker onset response to the second pulse.
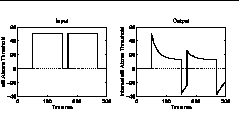
Psychoacoustic experiments provide evidence of adaptation for the complete auditory system. Although healthy human hearing has a dynamic range of over 100 dB, forward masking experiments reveal that over short durations, the usable dynamic range is significantly smaller, and largely dependent on the immediately preceding context. More specifically, when a brief probe tone follows a long-duration masking tone, the detection threshold for the probe can be considerably higher than it would have been without the masker. The increase in the probe threshold, or the amount of forward masking, is dependent on the level and duration of the masker, and on the delay between the masker and probe.
An interesting trend in this data indicates a faster recovery of the amount of forward masking with greater amounts of forward masking, or a complicated level-dependent adaptation [5]. However, this complexity is not necessary.
Our adaptation mechanisms add an exponentially adapting logarithmic offset to a logarithmically scaled input [6]. A target offset is determined from the (logarithmic) difference between the input and a compressive input/output function. At each point in (discrete) time the distance to the target offset is reduced by a fixed percentage.
With long-duration maskers, we assume complete adaptation by the time of the offset of the masker. Incremental recovery rates and the compressive I/O slopes can then be determined from forward masking thresholds measured for different masker levels and probe delays. Similarly, incremental adaptation rates are determined from forward masking experiments that vary the duration of the masker [7].
In our ASR front end, spectral estimates are obtained for approximate auditory filters every 10 ms. The log output from each filter is then processed by an independent adaptation stage. Therefore, the adaptation stages operate at the frame rate, incrementally adjusting a linear offset every 10 ms. Figure 3 shows a spectrogram after the adaptation processing.
Peak isolation
When comparing perceptual differences between synthesized vowels, the frequency position of spectral peaks is more significant than the bandwidths of the peaks and their relative amplitudes [8]. In addition, the vowel percept is largely unaffected by high-pass, low-pass, or band-pass filtering. On the other hand, short-time spectral estimates used for speech recognition are significantly influenced by filtering, and by the relative amplitudes and bandwidths of local spectral peaks.
Physiologically, a local spectral peak can dominate the temporal firing patterns of primary auditory neurons with center (or best) frequencies within an octave of the peak [9]. Similarly, suppression and lateral inhibition mechanisms are believed to improve the contrast of neural regions that map frequency to place, again highlighting the frequency position of local spectral peaks [10].
In earlier ASR systems that used explicit spectral distance measures, bandpass liftering the cepstral vector improved recognition performance [11]. Because the cepstral vector represents a frequency transformation of the log-magnitude spectral estimate, bandpass liftering reduces the weighting of relatively slow or fast changes (with frequency) across the spectral vector. The `medium-rate' changes that remain are influenced more by the frequency positions of the vocal-tract resonances, and less by the overall level, the long-term average spectrum of the talker in the channel, and fast changes due to numerical artifacts.
With statistical speech recognition, fixed scaling of the observation vector has no influence on performance. Means and covariances are scaled in both training and testing, and the final likelihoods are unaltered. Bandpass cepstral liftering also changes the level of one spectral peak as a function of other spectral peaks in that estimate, and symmetrically emphasizes spectral valleys as much as peaks.
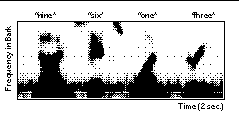
Modification of the cepstral liftering process addresses these issues [6]. A cepstral vector is first obtained from the original spectral estimate using a DCT. The cepstral vector is bandpass liftered, and an IDCT is used to obtain a modified spectral estimate. Peaks in the original spectral estimate are generally above zero, while valleys are below. The modified spectral estimate is half-wave rectified. Peaks in the modified spectral estimate are then scaled to the height of the original spectral estimate at that frequency position. A DCT of the modified, rectified, and scaled spectral estimate is used to obtain a final cepstral vector. In Figure 4, an IDCT has been used to show the spectral estimate implied by the final cepstral vector.
Parameterizing peak position and motion
Together, adaptation and peak isolation provide a strong response to onsets and spectral transitions, and highlight the position of local spectral peaks. Although feature vectors obtained from this processing may characterize perceptually salient aspects of the speech signal, the phonetically relevant position and motion of local spectral peaks [8] is only characterized implicitly. That is, the spectral estimates depend on the position of the spectral peaks, and the HMM's state sequences provide some characterization of the spectral peak motion, but these potentially robust attributes of the speech signal are not characterized directly in the statistical pattern matching process.
A three-stage processing scheme is introduced to estimate the position and motion of the local spectral peaks. These estimates augment the feature vector used for statistical recognition. Local spectral peaks are first identified in each frame by finding local maxima in the spectral estimate obtained after cepstral liftering. For each peak, the frequency and log-magnitude level from the corresponding point in the original spectral vector is stored. Figure 5.a shows the position of the spectral peaks.
Two stages are used to group the local peaks based on their spectro-temporal proximity. The first uses dynamic programming to connect the peaks into threads. Each peak in each frame connects to the closest thread that extends to at least one of the last two frames. If the closest frequency distance is more than roughly 10% of the entire (warped) frequency range, then a new thread is started. When no peak connects to a given thread for two consecutive frames, that thread is ended. Figure 5.b shows a moving seven-point second-order polynomial fit to each thread. Frequency-derivative estimates from the moving polynomials are stored for each peak.
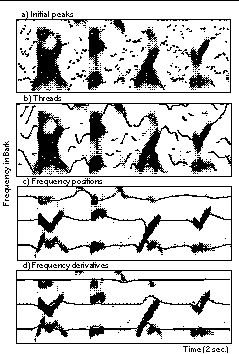
The final stage reduces the representation of the threads into three tracks, which are assigned center frequencies, or DC offsets, equally spaced on the warped frequency scale. At each frame, each track is incrementally adjusted toward the closest thread in that frame. The increment of adjustment is a sigmoidal function of the magnitude of the original peak. Tracks, therefore, update more quickly to stronger peaks. With no input, a track drifts back toward its center frequency. The tracks are finally low-pass filtered below a cut-off of 15 Hz. An identical process is used to track the frequency derivative estimates from the threads. Figure 5.c-d show the resulting frequency positions and derivatives.
Recognition evaluations
A discrete-word recognition task was used to evaluate the robustness of a variety of processing schemes. Digits from the TI-46 database were used at a random offset within roughly two seconds of silence. This requires the system to isolate the speech from the background.
Each digit was modeled using a six-state left-to-right HMM with continuous Gaussian densities. The forward/backward algorithm was used to estimate feature-vector means and state transition probabilities. A diagonal covariance estimate, from the entire training set, determined a global observation variance. Models derived from both clean and noisy data were used simultaneously, with the most probable model determining the digit recognized.
For all processing schemes, the feature vector included 12 cepstral coefficients (c0 was excluded), and 13 cepstral derivatives. Three peak frequencies, and two frequency derivatives were also included in the `threaded' evaluations. The frequency derivative of the highest peak was excluded because it had little variance.
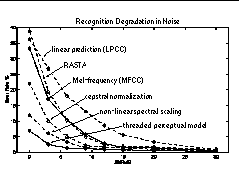
Background noise, shaped to match an estimate of the long-term average speech spectrum, was added to corrupt the speech signal for these evaluations. In addition to evaluations using linear prediction cepstral coefficients, Mel-frequency cepstral coefficients, and the relative-spectra (RASTA) technique [12], tests were performed using MFCC with five common techniques that are intended to improve feature-vector robustness: spectral subtraction, spectral scaling, non-linear spectral scaling, cepstral mean subtraction, and cepstral normalization. The top two of these last five are included in Figure 6.
Amplitude modulation cues
Short-time spectral estimates for speech recognition are averaged over a few pitch periods to minimize any influence of the periodic glottal pulses in voiced speech. However, a case study comparing the perception of [s] and [z] in noise shows that listeners can use pitch-rate amplitude-modulation cues for phonetic discrimination.
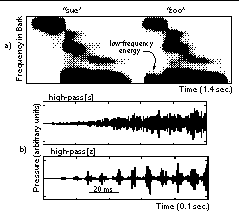
Figure 7.a is a spectrogram of the two syllables: "sue zoo." In a typical ASR system, the presence of low-frequency energy during the voiced fricative [z], would largely distinguish that sound from the unvoiced fricative [s]. Preliminary data indicate that listeners, on the other hand, are able to distinguish these sounds at a low SNR even after the signal is high-pass filtered above 3 kHz. In Figure 7.b, notice the pitch-rate amplitude-modulation cue in the temporal waveform of [z] after high-pass filtering. We are currently parameterizing models to predict the perceptual sensitivity to this cue, and are working to incorporate the model's response into an ASR system.
Conclusion
Current speech recognition systems characterize sequences of short-time spectral estimates as a non-stationary stochastic process. The techniques used to obtain the short-time spectral estimates provide rough approximations of two fundamental aspects of auditory perception: frequency selectivity and magnitude compression. Incorporating computationally simple mechanisms which reproduce other aspects of auditory perception, may increase the robustness and the phonetic relevance of the speech parameterization used for speech recognition. In this paper, mechanisms which provide adaptation and spectral peak isolation, together with an explicit statistical characterization of the position and motion of spectral peaks significantly improve the robustness of a discrete word recognition system.
Acknowledgments
This work was supported in part by NIDCD grant DC02033, and the NSF.
References
-
L. Rabiner and B. H. Juang, Fundamentals of Speech Recognition. Englewood Cliffs, NJ: Prentice-Hall, 1993.
-
M. J. F. Gales and S. J. Young, "Robust Continuous Speech Recognition Using Parallel Model Combination, IEEE Trans. Speech and Audio Proc., Vol 4., pp. 352-359.
-
N. Y. S. Kiang, Discharge Patterns of Single Fibers in the Cat's Auditory Nerve, MIT Press, Cambridge, MA, 1965.
-
R. S. Goldhor, "Representation of consonants in the peripheral auditory system: a modeling study of the correspondence between response properties and phonetic features," RLE Technical Report No. 505, MIT, Cambridge MA, 1985.
-
B. C. J. Moore, An Introduction to the Psychology of Hearing. 3d ed., Academic Press, London, 1989.
-
B. Strope and A. Alwan, "A model of dynamic auditory perception and its application to robust word recognition," IEEE Trans. Speech and Audio Proc., vol. 5, no. 5, pp. 451-464, Sept. 1997
-
G. Kidd Jr. and L. L. Feth, 1982. "Effects of masker duration in pure-tone forward masking," J. Acoust. Soc. Am., vol. 72, pp. 1364-1386, 1982.
-
D. Klatt, "Prediction of perceived phonetic distance from short-term spectra--a first step," J. Acoust. Soc. Am., vol. 70, Suppl. 1, S59, 1981.
-
B. Delgutte, "Representations of speech like sounds in the discharge patterns of auditory nerve fibers," J. Acoust. Soc. Am., vol. 68, pp. 843-857, 1980.
-
K. Wang and S. Shamma, "Self-normalization and noise-robustnessin early auditory representations," IEEE Trans. Speech and Audio Proc., vol. 2, pp. 412-435, July 1994.
-
H. Juang, L. R. Rabiner, and J. G. Wilpon, "On the use of bandpass liftering in speech recognition," IEEE Trans. Acoust., Speech, Sig. Proc., vol. 35, pp. 947-954, July 1987.
-
H. Hermansky and N. Morgan, "RASTA processing of speech," IEEE Trans. Speech and Audio Proc., vol. 2, pp. 578-589, Oct. 1994.


