A Novel
Structure to Compensate for Frequency-Dependent Loudness Recruitment of
Sensorineural Hearing Loss
B. Strope and A. Alwan
ABSTRACT
A simple structure that compensates for frequency-dependent loudness recruitment of sensorineural hearing loss is presented. The non-linear structure estimates total input signal energy, and then weights and combines the output of two parallel filters based on this energy estimation. Preliminary evaluation of this structure with noise-masked normal hearing listeners, and speech recorded in naturally noisy environments, shows a 15-20% performance increase in word recognition scores when compared to a linear structure.
INTRODUCTION
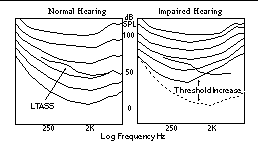
Typically, sensorineural hearing loss results in increased minimum hearing thresholds, and increased perceived loudness growth, or loudness recruitment. Quiet sounds are often inaudible, and above minimum audibility, increasing levels lead to more rapidly increasing perceived loudness. Alternatively, we can view these phenomena by comparing constant loudness contours of impaired hearing to those of normal hearing. There may be little difference at high-level contours, a distinct increase at low-level contours, and a decrease of the contour spacing in between. The threshold increase is the difference at low levels; loudness recruitment is the change in the spacing of the contours. Figure 1 shows estimates for these contours, and imposes a long term average speech spectrum (LTASS)[1] over each. For this moderate loss, notice threshold increase and loudness recruitment vary similarly with frequency; the greatest contour spacing change occurs where the threshold increase is greatest.
Linear hearing aids provide fixed frequency shaping and amplification intended to optimize speech intelligibility at normal listening levels, as suggested by the NAL standard [1]. The wearer uses a volume control on the aid to adjust for different environments. Obviously, linear aids do not address loudness recruitment. Compression amplifiers provide gain as a function of input level: low-level inputs are amplified more than high-level inputs [2]. Used in hearing aids, wide-band compression schemes do not account for frequency-dependent loudness recruitment. Multi-channel compression algorithms [3], which divide the signal into frequency bands and compress each band separately, consider the frequency-dependency of loudness recruitment, and therefore provide better utilization of the available dynamic range (across frequency). The complexity of these systems, however, may limit their wide-spread use. Not only is the hardware requirement potentially significant, but prescribing, or even determining, a composite frequency response, while different bands are under different amounts of compression, is non-trivial, and therefore, in many cases, may result in sub-optimal fitting.
In this paper, we propose a simple mixing structure that has a level-dependent transfer function. At the lowest input levels, the transfer function is roughly the threshold increase; at the highest, it approaches unity. In between, there is a smoothly varying transfer function continuum. With minimal complexity, this structure compensates for frequency-dependent loudness recruitment.
Motivation
Proper placement of the long term average speech spectrum within impaired loudness contours is crucial for audibility and therefore intelligibility (figure 1). Our goal is to place the long term average speech spectrum within the loudness contours of the impaired hearing at a position similar to its position within the contours of normal hearing. A first approach is to "map" estimated normal loudness contours to those of the impaired hearing. That is, low level inputs (40-50 dB SPL) along the lowest loudness contours of normal hearing require a transfer function equal to the difference between the normal and impaired thresholds in order to be similarly placed within the lowest loudness contours of the impaired hearing. Similarly high-level inputs (near 100 dB SPL) along the highest contours require the difference between the highest level contours in order to be similarly placed for the impaired hearing. In between these extremes, we require a continuum of transfer functions, smoothly varying as a function of input intensity from the difference of the quietest constant loudness contours to the difference of the loudest.
Architecture Overview
Figure 2 shows the block diagram for the proposed mixture structure. The input signal propagates through two linear filters which are the transfer functions necessary for placing the loudest and quietest expected inputs. The outputs of these filters are weighted as a function of input intensity and combined to produce the final output. With quiet inputs, the weighting favors the filter that is the transfer function required for threshold level audibility. With louder inputs, the weighting favors the filter that is the transfer function required for properly placing high level inputs. In between these, there is a continuum of smoothly varying (level-dependent) transfer functions. Notice, the filters must have matched phase responses to generate a smooth continuum of composite frequency responses. Linear-phase FIR filters are used in the digital implementation evaluated below.
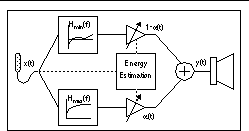
For discussion, we label the filter that provides the transfer function for the quietest input (the most correction) H
max
(f), and the filter that provides the transfer function for the loudest input (the least correction) H
min
(f). The input energy estimation in our digital implementation is a running average over a fixed window length, updated at each sample, and converted to dB SPL. The energy estimation block provides the slowly varying weighting function a(t) for H
max
(f) and 1-a(t) for H
min
(f).
Algebraically, the system I/O relationship is:
y(t) = a(t) (x(t) * hmax(t)) + (1 - a(t)) (x(t) * hmin(t))
a(t) = f(x(t)), where 0 < a(t) < 1
Mixing Algorithm
Linear mixing between the two filters requires defining a minimum input energy threshold, below which the structure selects H
max
(f) entirely, and a slope parameter that determines how much a(t), the weighting of H
max
(f), is decreased (and the weighting of H
min
(f) increased) with each additional dB of input intensity. We define these two parameters as the mix threshold, and the mix slope, respectively.
Dynamic Parameters
Three dynamic parameters define how the weighting functions are updated. The first is the window length over which input energy is estimated. The second and third are time constants which define how quickly the weighting adjusts in each direction as a function of the input energy estimation. These are similar to the attack and release parameters in compression amplifiers. Initial evaluation suggests that for a moderate hearing loss, a 500 msec energy window, with 20 msec "attack" and 40 msec "release" time constants provide reasonable results.
Choosing the Transfer Function Continuum
With different H
min
(f), H
max
(f), mix threshold, and mix slope parameters, this structure avails itself to a wide range of continually varying transfer function possibilities. Initially we evaluate two strategies. (For the following discussion, we consider the hearing loss with loudness contours shown in figure 1, and threshold increase shown later in figure 6.)
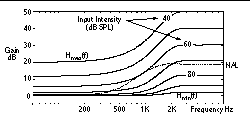
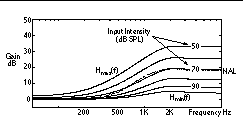
First, choose the continuum of transfer functions that are the difference between the normal and impaired loudness contours. This approach uses the threshold increase for H
max
(f), no correction for H
min
(f), 40 dB SPL for the mix threshold, and 1.0 for the mix slope. Figure 3 shows the resulting transfer function continuum with the NAL prescription super-imposed for reference..
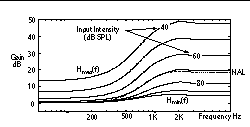
Second, start with the NAL standard prescribed correction at normal listening levels, but decrease the correction as input intensity increases, and increase the correction as input intensity decreases. This approach uses roughly twice the NAL standard (0.6 times the threshold increase instead of 0.3) for H
max
(f), almost no correction for H
min
(f), 50 dB SPL for the mix threshold, and 0.75 for the mix slope. Figure 4 shows the resulting transfer function continuum for the second strategy, again referenced to the NAL prescription.
Preliminary evaluation of these two approaches over a wide dynamic range of inputs suggests that the NAL-derived method improves performance for input data at normal levels (near 70-80 dB SPL), and the mapped loudness contour approach improves performance at low input levels (below 60 dB SPL).
Together, these results lead to a hybrid continuum that starts with the mapped contour approach, but adjusts H
max
(f) and H
min
(f) so that the continuum of transfer functions intersects the NAL standard more precisely as the input passes through normal listening levels. Mix threshold is 40 dB SPL, and mix slope is 1. The resulting continuum of transfer functions appears in figure 5 and is the continuum evaluated in our experiments.
Masking Subjects with Shaped Noise
Three noise-masked normals, 22-27 years old, with no known speech or hearing impairments, participated in the evaluation. The target moderate hearing loss is shown in figure 6. Shape of the noise masker is adjusted until tested hearing thresholds (with the masking noise) are within +5 dB of the target. Masking noise is binaurally uncorrelated, test tones are monaural, and each ear is tested independently. The same target hearing loss is imposed on both ears.
Methods
Sentences from the HINT list [4] are recorded in two naturally noisy environments: in a moving car, and at the beach on a fairly windy day. From these recordings, 46 sentences with 255 words are used. The naturally noisy environment creates a realistically dynamic segmental SNR, typically challenging for hearing aid wearers, with 60-80% word intelligibility for normal hearing. During testing, the sentences are played over a wide dynamic range (45-95 dB SPL). Testing occurs in a double-walled sound-proof chamber, and signal processing is provided through a 16-bit digital system at a 16 KHz sampling rate. All recordings and processing are stereo.
We compare the mixing structure to a single-filter structure with gain and fixed frequency response set by the NAL prescription [1]. Moderate output compression limiting (threshold 85 dB SPL, ratio 3:1, 2ms and 40ms attack and release) is included to keep high level inputs within comfort limits for this nearly linear structure. The shaping filter for the NAL correction is a 63-tap linear-phase FIR filter, as are the filters that implement H
max
(f) and H
min
(f).
Testing occurs in two sessions. In the first, we verify target thresholds with the shaped-noise masker and familiarize the subjects to listening to the recorded data through the mask. In the second we compare the two processing schemes, randomly ordering sentences processed by each scheme. After listening to a processed sentence through the mask, subjects repeat the sentence, or words, heard. No feedback is provided. Each session lasted around 1 hour. Percentage correct scores are determined on a word by word basis using data from the second session.
Results
Results appear in Table 1. The percentage increase is the score increase divided by the baseline score. All subjects show improvement with the proposed system.
. Experimental Results
|
Subject
|
Linear
|
Mixture
|
Increase
|
|
1
|
59%
|
72%
|
22%
|
|
2
|
47%
|
57%
|
21%
|
|
3
|
67%
|
76%
|
13%
|
SUMMARY AND DISCUSSION
A simple filter mixing structure is an effective technique to provide a continuum of level-dependent transfer functions to compensate sensorineural hearing loss. Because the LTASS falls roughly parallel to constant loudness contours of normal hearing, a continuum of transfer functions which are the difference between the contours of the impaired and normal hearing (with some 500-1500 Hz emphasis) may be a reasonable fitting starting point.
This structure places LTASS within impaired loudness contours based on total signal energy. Fundamentally, it exploits the close relationship between threshold increase and loudness recruitment; frequencies where the threshold increase is the greatest are also the frequencies where the loudness growth is the steepest. Further, the structure relies on the downward-sloping average shape of speech, common to many natural sounds, and is not well-suited for pure tone inputs. It also relies on the observation that loudness contours of impaired hearing are nearly equally spaced within the available dynamic range. Were this not the case, the mixing algorithm would need to be more complicated than a simple linear function.
Clearly, the LTASS alone provides no information to the listener. Instead, listeners most likely perceive speech from the deviations from the long term average. However, by properly placing the LTASS, the simple structure presented here provides the opportunity for the listener to hear the deviations without reducing the deviation's dynamic range. It compensates for frequency-dependent loudness recruitment, similar to a multi-band structure, but does not reduce the dynamic range of the short term deviations, similar to a linear structure. Further, its computational complexity is significantly lower than that of other recently proposed non-linear structures [5,6] permitting integration with existing technology.
Future work will investigate dynamic parameter selection, evaluation with different hearing losses, and perhaps hybridization with a multi-band structure for severe losses.
We thank Dr. Don Dirks for helpful discussions. UCLA and the NIDCD supported this work.
Etymotic Research K-AMPTM
After defining and evaluating the structure, we found that the commercial K-AMPTM aid [7] also has a level-dependent frequency response. Detailed technical specifications for this circuit remain proprietary. However, the "Technical Sheet" details a relatively fixed (in frequency and intensity) 13-25 dB high-frequency increase for quiet (40 dB SPL) inputs varying to no increase for loud (90 dB SPL) inputs. The shape of the continuum of transfer functions with this aid will always have the characteristic 13-25 dB level-dependent change, most noticeable around 3KHz, regardless of the specific hearing loss. This suggests a varying "treble-boost" circuit, as opposed to the more generic filter mixing algorithm described here. As a result, with the K-AMPTM aid we would expect difficult fitting for impairments which are not moderate high frequency losses, as is, in fact, outlined in the K-AMPTM "A Practical Guide."
REFERENCES
-
D. Byrne, H. Dillon, "The National Acoustic Laboratory's (NAL) new procedure for selecting the gain and frequency response of a hearing aid," Ear and Hearing, 7, 257-265 (1986).
-
G. Walker, H. Dillon, Compression in Hearing Aids: an Analysis, a Review and some Recommendations, NAL Report No. 90, (1982)
-
R. Lippman, L. Braida, N. Durlach, "Study of multichannel amplitude compression and linear amplification for persons with sensorineural hearing loss," J. Acoust. Soc. Am.
69
, 534 (1981).
-
M. Nilsson, S. Soli, J. Sullivan, "Development of the Hearing In Noise Test for the measurement of speech reception in quiet and in noise," J. Acoust. Soc. Am. 95, 1085-1099 (1994).
-
F. Asano, et al., "A digital hearing aid that compensates loudness for sensorineural impaired listeners," ICASSP Proceedings, IEEE, 3625-3628 (1991).
-
J. Rutledge, M. Clements, "Compensation for recruitment of loudness in sensorineural hearing impairments using a sinusoidal model of speech," ICASSP Proceedings, IEEE, 3641-3644 (1991).
-
Etymotic Research, "K-AMPTM Technical Information and A Practical Guide," 61 Martin Lane, Elk Grove Illinois 60007, (708) 228-0006, (1991).


