HRESULTS is the HTK performance analysis tool. It reads in a set of label files (typically output from a recognition tool such as HVITE) and compares them with the corresponding reference transcription files. For the analysis of speech recognition output, the comparison is based on a Dynamic Programming-based string alignment procedure. For the analysis of word-spotting output, the comparison uses the standard US NIST FOM metric.
When used to calculate the sentence accuracy using DP the basic output is recognition statistics for the whole file set in the format
   --------------------------- Overall Results -------------------
   SENT:  %Correct=13.00 [H=13, S=87, N=100]
   WORD:  %Corr=53.36, Acc=44.90 [H=460,D=49,S=353,I=73,N=862]
   ===============================================================
The first line gives the sentence-level accuracy based on the total number of label files which are identical to the transcription files. The second line is the word accuracy based on the DP matches between the label files and the transcriptions 17.15. In this second line,
%Correct |
(17.7) |
Accuracy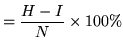 |
(17.8) |
In addition to the standard HTK output format, HRESULTS provides an alternative similar to that used in the US NIST scoring package, i.e.
    |=============================================================|
    |           # Snt |  Corr    Sub    Del    Ins    Err  S. Err |
    |-------------------------------------------------------------|
    | Sum/Avg |   87  |  53.36  40.95   5.68   8.47  55.10  87.00 |
    `-------------------------------------------------------------'
When HRESULTS is used to generate a confusion matrix, the values are as follows:
====================== HTK Results Analysis =======================
  Date: Thu Jan 10 19:00:03 2002
  Ref : labels/bcplabs/mon
  Rec : test/te1.rec
      : test/te2.rec
      : test/te3.rec
------------------------ Overall Results --------------------------
SENT: %Correct=0.00 [H=0, S=3, N=3]
WORD: %Corr=63.91, Acc=59.40 [H=85, D=35, S=13, I=6, N=133]
------------------------ Confusion Matrix -------------------------
       S   C   V   N   L  Del [ %c / %e]
   S   6   1   0   1   0    0 [75.0/1.5]
   C   2  35   3   1   0   18 [85.4/4.5]
   V   0   1  28   0   1   12 [93.3/1.5]
   N   0   1   0   7   0    1 [87.5/0.8]
   L   0   1   1   0   9    4 [81.8/1.5]
Ins    2   2   0   2   0
===================================================================
Reading across the rows, %c indicates the number of correct instances
divided by the total number of instances in the row. %e is the
number of incorrect instances in the row divided by the total number
of instances (N).
Optional extra outputs available from HRESULTS are
-e ??? X would be used.
Label files containing triphone labels of the form A-B+C can be
optionally stripped down to just the class name B via the -s
switch.
The word spotting mode of scoring can be used to calculate hits, false alarms and the associated figure of merit for each of a set of keywords. Optionally it can also calculate ROC information over a range of false alarm rates. A typical output is as follows
------------------------ Figures of Merit -------------------------
      KeyWord:    #Hits     #FAs  #Actual      FOM
            A:        8        1       14    30.54
            B:        4        2       14    15.27
      Overall:       12        3       28    22.91
-------------------------------------------------------------------
which shows the number of hits and false alarms (FA) for two keywords
A and B. A label in the test file with start time Note that for keyword scoring, the test transcriptions must include a score with each labelled word spot and all transcriptions must include boundary time information.
The FOM gives the % of hits
averaged over the range 1 to 10 FA's per hour. This is calculated
by first ordering all spots for a particular keyword according to
the match score. Then for each FA rate ![]() , the number of hits are counted
starting from the top of the ordered list and stopping when
, the number of hits are counted
starting from the top of the ordered list and stopping when
![]() have been encountered. This corresponds to a posteriori
setting of the keyword detection threshold and effectively gives an
upper bound on keyword spotting performance.
have been encountered. This corresponds to a posteriori
setting of the keyword detection threshold and effectively gives an
upper bound on keyword spotting performance.