This study aims to clarify the intrinsic limitations of electrochemical impedance spectroscopy (EIS) in measuring electric double layer (EDL) capacitance. For more than two decades, capacitances measured using EIS at low frequencies have been reported to be significantly smaller than those measured using other techniques without any definitive explanations. In this paper, EIS measurements were numerically reproduced for electric double layers formed near a planar electrode in aqueous electrolyte solutions. The transient double layer dynamics was simulated for low and large electrolyte concentrations using the classical Poisson-Nernst-Planck (PNP) model with or without a Stern layer, and a modified PNP model with a Stern layer, respectively.
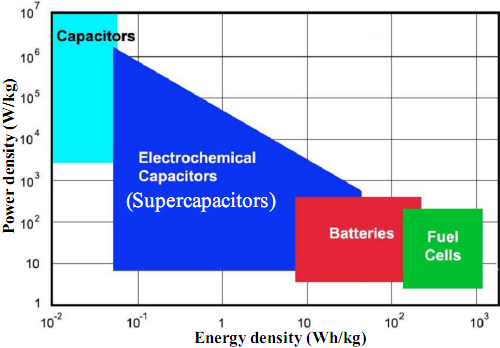
Fig.1 shows the power density versus energy density of different electrical energy storage devices. Due to their physical charge storage, capacitors feature very large power densities compared with batteries and fuel cells but low energy densities. On the other hand, batteries and fuel cells have large energy densities but low power densities due to their slow reaction kinetics. Electrochemical capacitors (ECs), also called supercapacitors, have been somewhat overlooked for energy storage applications. They store energy by either ion adsorption (electrochemical double layer capacitors or EDLCs) without or with fast surface redox reactions (pseudocapacitors). ECs bridge the gap between capacitors and batteries/fuel cells. They offer the prospect of maintaining the high energy density of batteries without compromising the high power density of capacitors. |
Fig.1. Power density vs. energy density of various energy storage systems. |
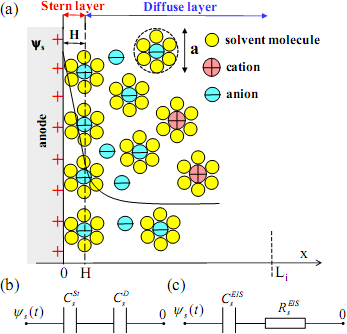
Electrochemical Impedance Spectroscopy ( EIS) measurements consist of imposing a time harmonic electric potential with a certain frequency at the electrodes. This harmonic potential consists of two components: (i) a time-independent "DC potential" and (ii) a periodically oscillating potential with a small amplitude typically less than 10 mV. The resulting electric current is recorded. Then, the magnitude of the electrochemical impedance can be defined as the ratio of the amplitudes of oscillating potential and current while its phase angle is the shift by which the current is ahead of the potential. A simple RC circuit consisting of a resistor and a capacitor in series is most commonly used to model pure electric double layers (i.e., without Faradic reaction) forming at an electrode as shown in Figure 2c. The resistance and capacitance for a given frequency are retrieved from the in-phase and out-of-phase components of the measured electrochemical impedance, respectively. The double layer capacitance measured by EIS is typically plotted as a function of frequency.
Fig.2. Schematic of (a) the electric double layer structure near an anode/electrolyte interface and the simulated computational domain consisting of the Stern layer and the diffuse layer, (b) the Stern and diffuse layer capacitances in series, and (c) the equivalent RC circuit used in EIS. |
In EIS measurements, the electric potential ys(t) imposed at the electrode is a harmonic function of time t. This results in a harmonic current density Js (in A/m2) provided that the amplitude of the harmonic potential is small enough (e.g., less than 10 mV). Using complex notations, the imposed electric potential and the corresponding current density can be expressed as ys(t)= ydc+ y0exp(i2pft) and Js(t)=Jdc+J0exp[i(2pft- f)] where ydc and Jdc are time-independent DC potential and DC current density, respectively. Here, y0 and J0 are the amplitudes of the potential and current density around their DC components, respectively. The imaginary unit is denoted by i, f is the frequency expressed in Hz, while f(f) is the frequency-dependent phase angle between the harmonic potential ys(t) and the current density Js(t). The complex electrochemical impedance Z is defined as, Z = (y0/J0) exp(if)= Z' + i Z'' where Z' and Z'' (expressed in Wm2) are the real and imaginary parts of the impedance, respectively. Based on the equivalent RC circuit shown in Figure 2c, the resistance and capacitance per unit surface area (also called specific resistance and capacitance) are given by, RsEIS = Z' and CsEIS = -1/2p fZ'' The above equation is the most commonly used formula to determine the capacitance of EDLCs from EIS measurements. |
In this study, a characteristic time for ion diffusion was identified as ![]() where
where ![]() is the Debye length
is the Debye length ![]() 1/2 based on the maximum ion concentration.
1/2 based on the maximum ion concentration.
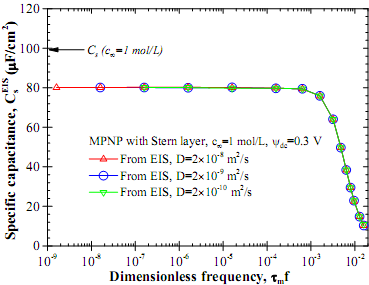
Fig.3. Predicted specific capacitance CsEIS determined from EIS as a function of dimensionless frequency tmf. Results were obtained by numerically solving the MPNP model with Stern layer along with the specific capacitance Cs with H=a/2=0.33 nm, c∞=1 mol/L, ydc =0.3 V, and ion diffusion coefficient D=2×10⁻⁸, 2×10⁻⁹, and 2×10⁻¹⁰ m2/s. |
Fig.4. Relative error between EIS estimates of CsEIS and double layer capacitance Cs as a function of DC potential obtained by solving (i) the classical PNP model with or without a Stern layer for c∞=0.01 mol/L and (ii) the MPNP model with a Stern layer for c∞=1 mol/L. |
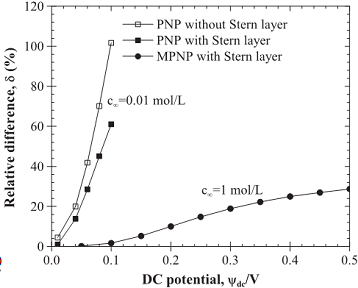
The EIS simulations overestimated the electric double layer capacitance for dilute electrolyte solutions while they underestimated it for concentrated electrolyte solutions. This corroborates existing experimental observations reporting the discrepancies between EIS measurements and other techniques such as cyclic voltammetry. This discrepancy can be attributed to the fact that the RC circuit used in EIS to model electric double layers is not valid. This study established that the EIS measurements have intrinsic limitations and are inadequate for accurately determining EDL capacitances for practical applications with large potentials such as electrochemical capacitors.
H. Wang and L. Pilon, 2012. Intrinsic Limitations of Impedance Measurements in Determining Electric Double Layer Capacitances, Electrochimica Acta, Vol. 63, pp. 55–63. doi 10.1016/j.electacta.2011.12.051.