Abstract
This study examines the annual energy and cost savings potential of adding microencapsulated phase change material to the exterior concrete walls of an average-sized single family home in California climate zones 3 (San Francisco, CA) and 9 (Los Angeles, CA). The annual energy and cost savings were larger for South- and West-facing walls than for other walls. They were also the largest when the phase change temperature was near the desired indoor temperature. The addition of microencapsulated phase change material to the building walls reduced the cooling load in summer substantially more than the heating load in winter. This was attributed to the cold winter temperatures resulting in nearly unidirectional heat flux on many days. The annual cooling load reduction in an average-sized single family home in San Francisco and in Los Angeles ranged from 85-100% and from 53-82%, respectively, for phase change material volume fraction ranging from 0.1 to 0.3. The corresponding annual electricity cost savings ranged from $36-$42 in San Francisco and from $94-$143 in Los Angeles. From an energy standpoint, the best climate for using building materials containing uniformly distributed microencapsulated phase change material would have outdoor temperature oscillations centered around the desired indoor temperature for the entire year.
Peak electricity demand and time of use pricing
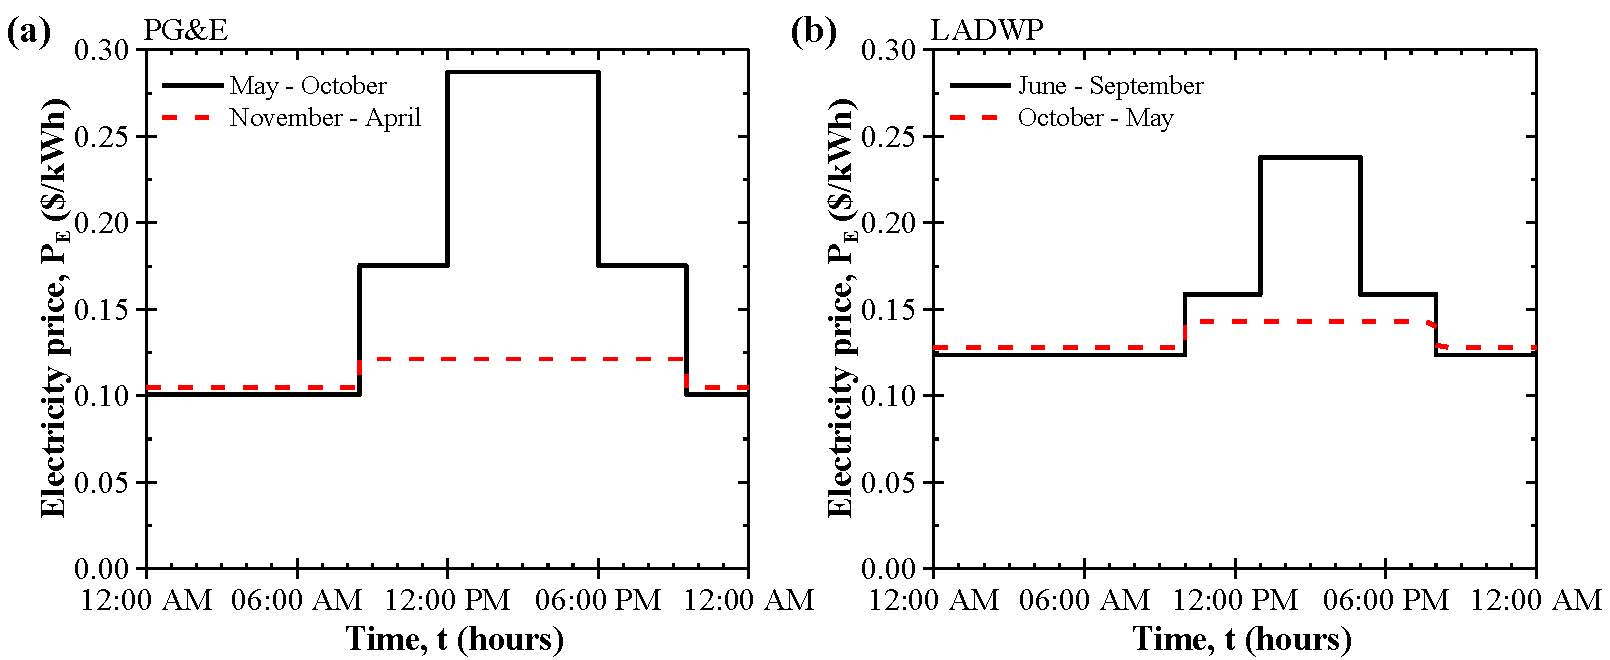
Electricity demand follows a reliable diurnal variation. It is minimal at night time and increases to a peak that typically occurs in the late afternoon [1]. Furthermore, electricity demand is often substantially larger during the summer, due to the fact that air conditioning systems consume large amounts of electricity [1]. Electric grid operators satisfy demand throughout most of the year using baseload plants. However, they rely on peaker plants during large demand periods such as summer afternoons to avoid grid damage and blackouts. Peaker plants are substantially more costly to operate and typically run on fossil fuels. In fact, the cost of generating electricity can be as much as ten times larger during peak hours than during night time [1].
To encourage ratepayers to reduce peak-hour electricity consumption, California utilities such as Pacific Gas and Electric (PG&E) and the Los Angeles Department of Water and Power (LADWP) have adopted time of use (TOU) electricity rate schedules for their residential and commercial customers. Figure 1a and 1b plot the electricity rate as a function of time throughout a summer and winter day under a TOU schedule for PG&E and LADWP, respectively.
Schematics and Assumptions
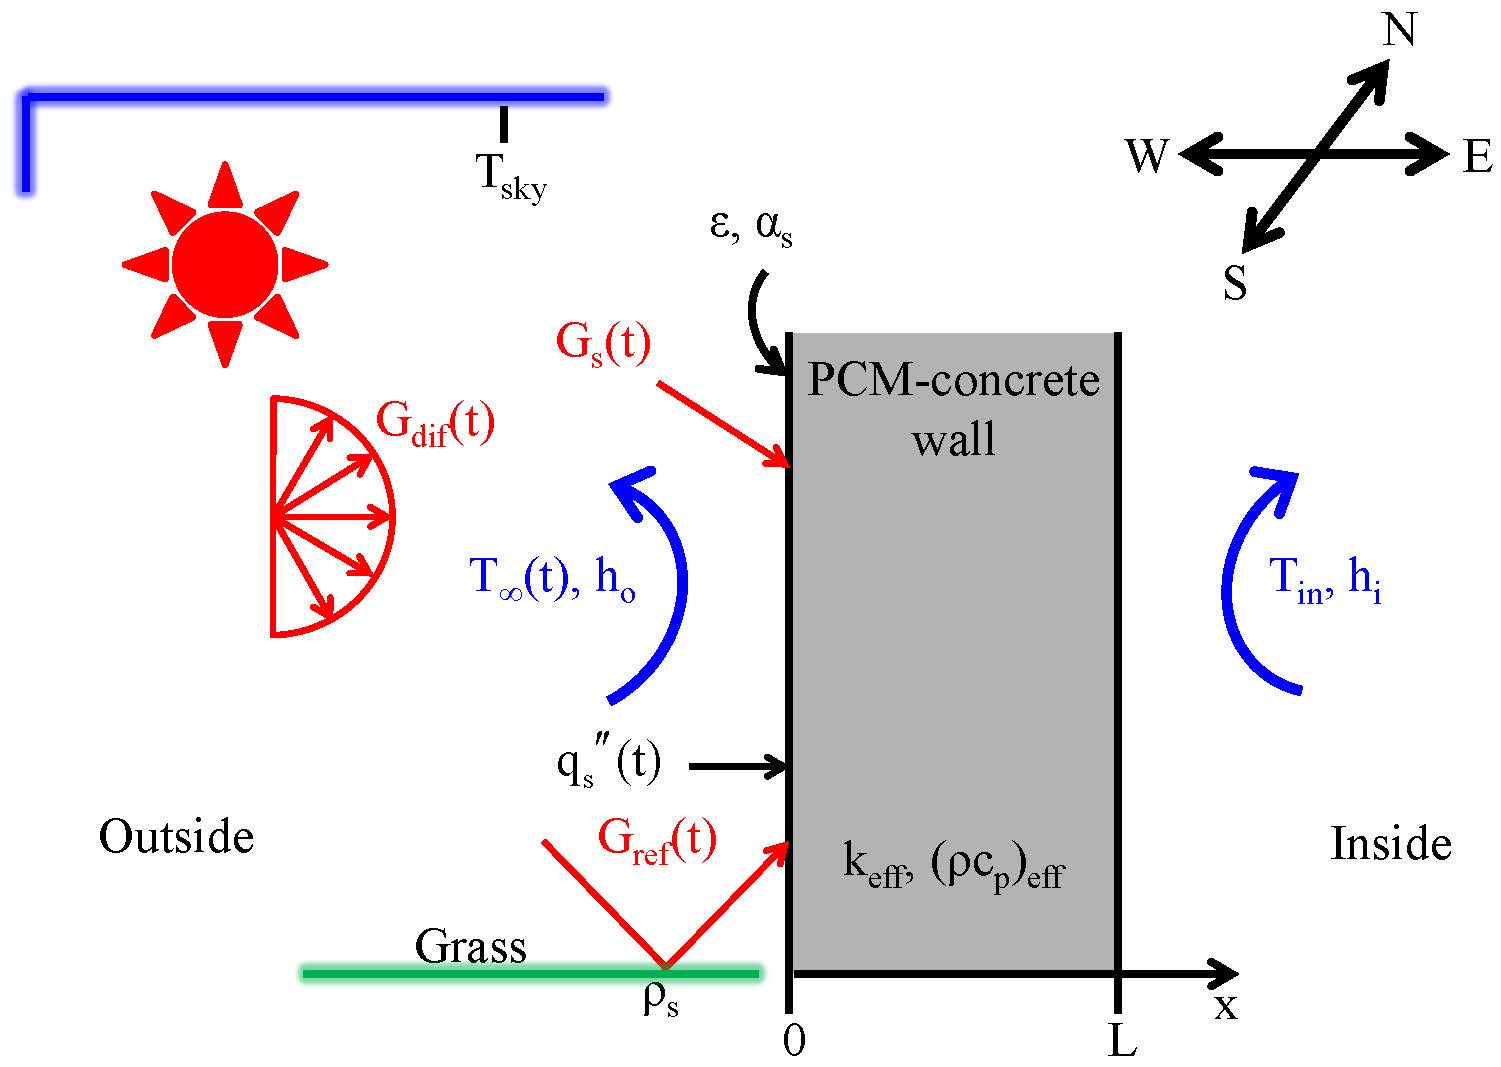
Figure 2 illustrates a microencapsulated PCM-concrete wall element of thickness L = 10 cm with effective volumetric heat capacity (ρcp)eff and effective thermal conductivity keff given by Equations 3 and 4, respectively. The wall was subjected to convective heat transfer at the inside surface and to both convective and radiative heat transfer at the outside surface. The latter consisted of (i) diffuse and collimated solar radiation, (ii) radiation exchange with the sky, and (iii) solar radiation diffusely reflected by grass around the building. The variation of the solar radiation heat flux incident on the North, South, East, or West wall was also considered.
Assumptions:
|
Figure 2. Schematic of a homogeneous wall of thickness L = 10 cm with effective volumetric heat capacity (ρcp)eff and effective thermal conductivity keff, representative of a micro-encapsulated PCM-concrete. The wall was subjected to convection at the inside surface x = L and to both convection and solar radiation heat flux at the outside surface x = 0 m. |
The home energy efficient design (HEED) software compliant with the California Energy Commission procedures was used to generate a reference simulation home that met California building code based on the average floor area of a single-family home of 240 m2 (2600 ft2). HEED determined the North and South wall areas to be 39.4 and 37.5 m2, respectively, and both the East and West wall areas to be 27.9 m2. These dimensions were used consistently in the present study. Note that the analysis did not account for the presence of windows or doors for the sake of simplicity.
Governing equations and boundary conditions
Under the above assumptions, the local wall temperature T(x,t) at any time t and location x was governed by the one-dimensional (1D) transient heat conduction equation,
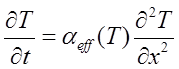
where αeff(T) = keff/(ρcp)eff(T) and is the effective thermal diffusivity. Note that αeff(T) is a function of the local temperature T since it accounts for the temperature-dependent specific heat of the PCM. The effective volumetric heat capacity can be expressed as,
![]()
where ϕc and ϕs are the volume fractions of the core and shell materials, while (ρcp)c, (ρcp)s, and (ρcp)m are the volumetric heat capacities of the core, shell, and matrix materials, respectively. By defining cp,c(T) based on the effective heat capacity method, (ρcp)eff(T) can be expressed as,
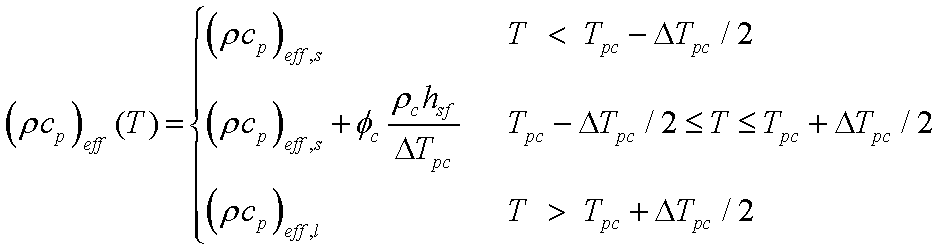
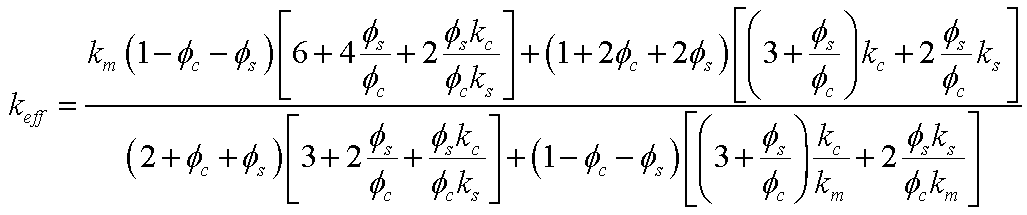
where (ρcp)eff,s is the effective volumetric heat capacity of the PCM-concrete composite wall with unmelted PCM. Here, it was assumed to be equal to the effective volumetric heat capacity of the composite with fully melted PCM, i.e., (ρcp)eff,s = (ρcp)eff,s. Moreover, Felske [2] used the self-consistent field approximation to derive an effective medium approximation (EMA) to predict the effective thermal conductivity keff of monodisperse spherical capsules randomly distributed in a continuous matrix given by,
This expression was validated using detailed numerical simulations of ordered and randomly distributed monodisperse and polydisperse microcapsules. Convective heat transfer was imposed at the interior wall surface x = L with a constant indoor temperature Tin maintained by the HVAC system so that,
![]()
where hi is the indoor mixed convective heat transfer coefficient accounting for both forced and natural convections. Combined convective and radiative heat transfer was imposed at the exterior wall surface given by,
![]()
where ho is the outdoor convective heat transfer coefficient, T8(t) and Tsky respectively represent the outdoor and average sky temperatures, q"s(t) is the solar radiation heat flux at time t, and σ is the Stefan-Boltzmann constant, i.e., σ = 5.67x10⁻⁸ W/m2K4. In addition, αs and εs are the total hemispherical solar absorptivity and emissivity of the outdoor wall surface, respectively. They typically differ since solar radiation is concentrated in the visible and near infrared while the outer wall surface emits radiation in the mid-infrared. The outdoor temperature T8(t) and solar radiation heat flux q"s(t) used as boundary conditions were obtained from Climate Consultant software for North-, South-, East-, and West-facing vertical walls for a typical year in California climate zones 3 (San Francisco) and 9 (Los Angeles) in 1 hour increments. Figures 3a and 3b plot the outdoor temperature T8(t) and solar radiation heat flux q"s(t) as functions of time over the entire year in Los Angeles.
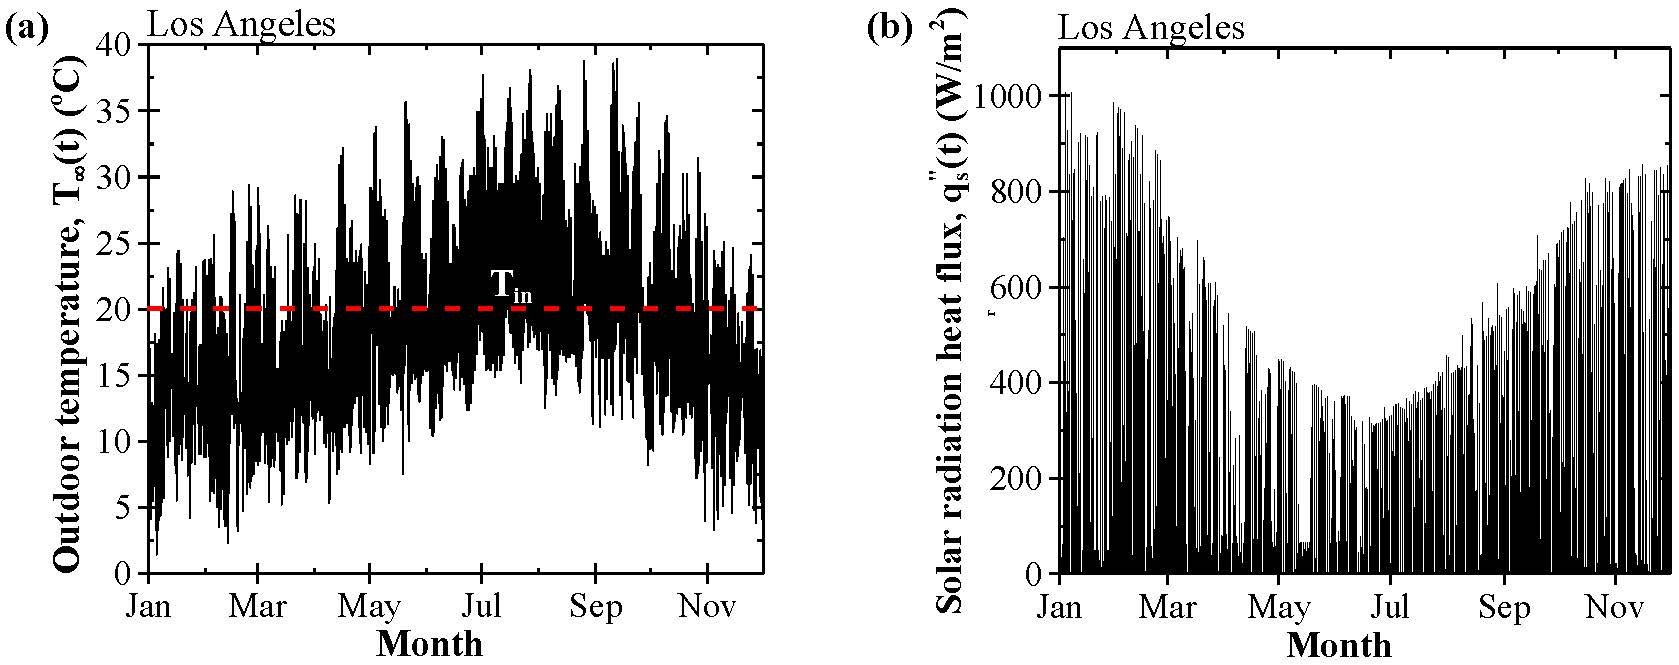
Figure 3. Outdoor temperature T8(t) and solar radiation heat flux q"s(t) as functions of time over one year for a South-facing wall in Los Angeles.
Results and Discussion
Figure 4 plots the inner surface heat flux q"L,S(t) as a function of time over one year for a South-facing wall located in Los Angeles with thermal properties corresponding to a plain concrete wall or to a concrete wall containing microencapsulated PCM with volume fraction ϕc ranging from 0.1 to 0.2. The phase change temperature Tpc was taken to be equal to the desired indoor temperature Tin= 20°C. It shows that adding microencapsulated PCM to the concrete wall decreased the amplitude of the inner surface heat flux q"L,S(t) throughout the year. Furthermore, the total thermal load was reduced much more during summer months when the temperature oscillations were centered closer to the desired indoor temperature Tin. This can be attributed to the fact that q"L,S(t) was nearly unidirectional during the heating season (winter) in but not during the cooling season (summer).
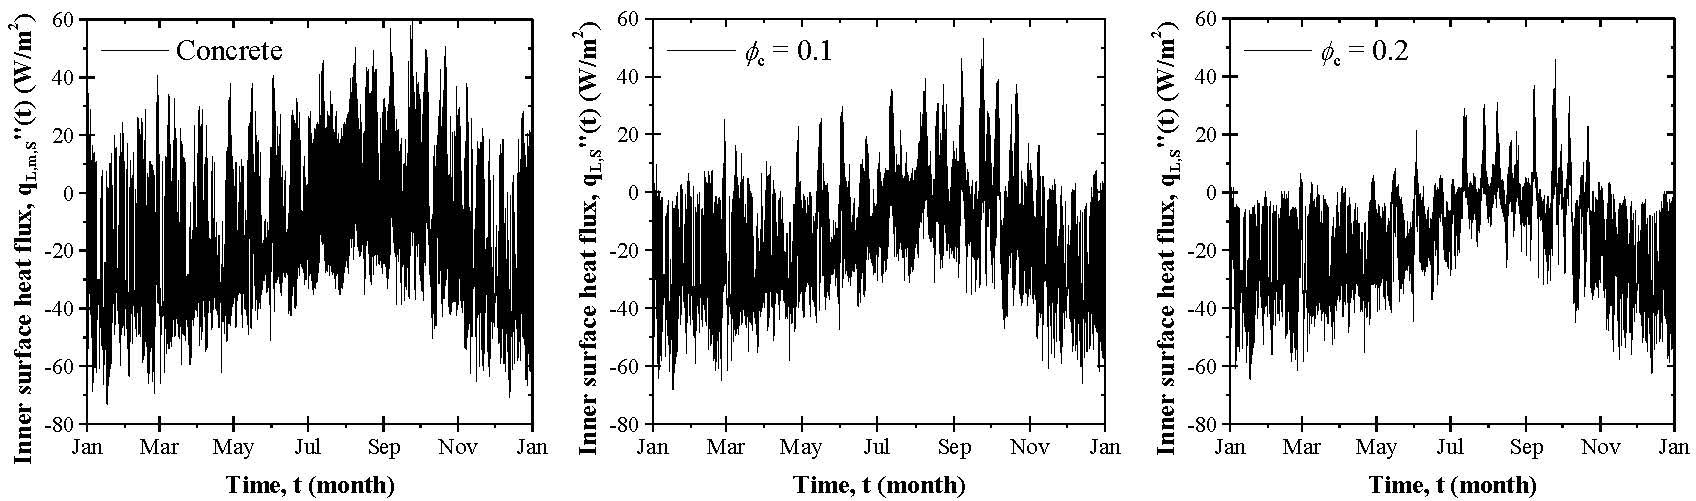
Figure 4. Inner surface heat flux q"L,S(t) as a function of time over one year for a South-facing plain concrete wall or for a microencapsulated PCM-concrete wall with ϕc ranging from 0.1 to 0.2 in Los Angeles.
Figures 5a and 5b plot the annual relative energy flux reduction E"r,j and cost savings per unit wall surface area S"T,j, respectively, achieved for the North-, South-, East-, and West-facing microencapsulated PCM-concrete walls as a function of PCM volume fraction ϕc ranging from 0 to 0.3 in Los Angeles. It is evident that for every wall orientation, the annual energy flux reduction E"r,j and cost savings per unit wall area S"T,j were the largest for the West- and South-facing walls. This can be attributed to the fact that the solar radiation heat flux q"s(t) incident on the South- and West-facing walls resulted in oscillations in the inner wall surface temperature TL(t) centered closer to Tin than those at the East- and North-facing walls.
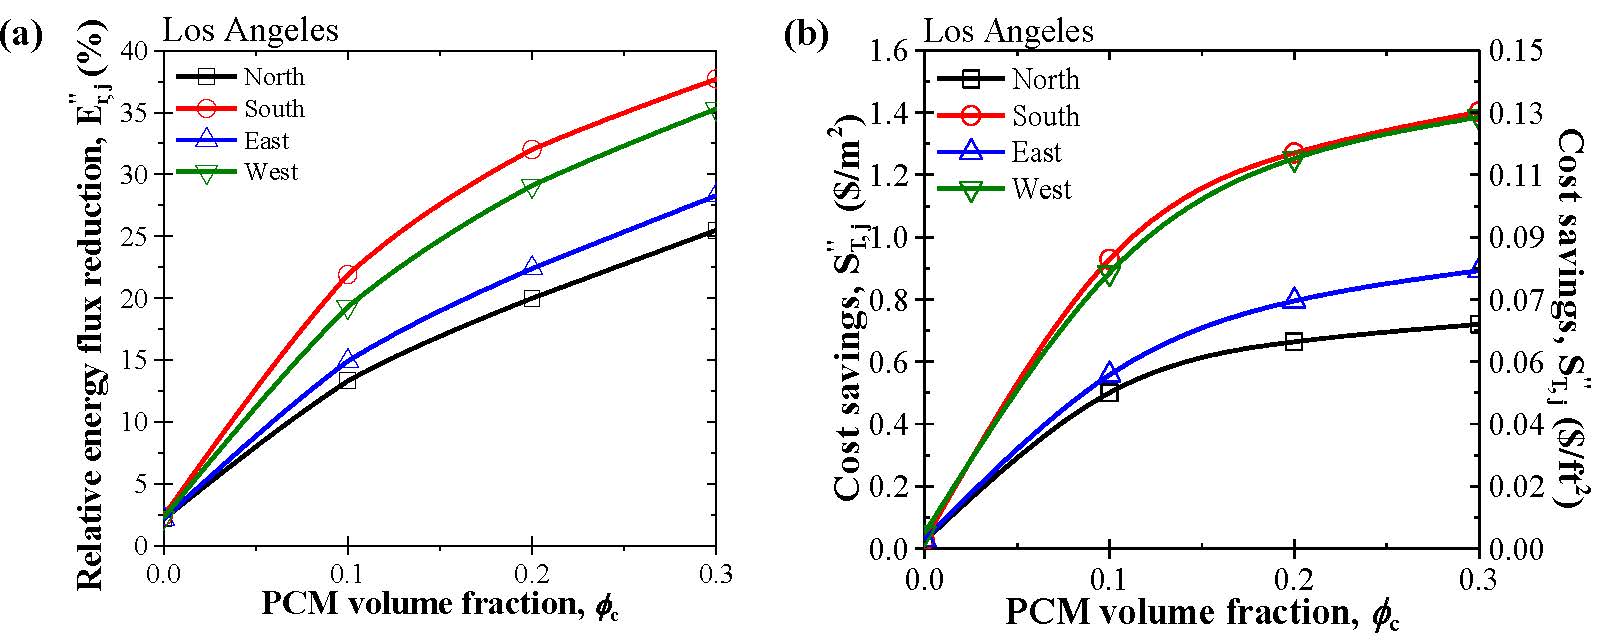
Figure 5. (a) Relative energy flux reduction E"r,j for North-, South-, East-, and West-facing walls and (b) corresponding cost savings per unit wall surface area S"T,j in Los Angeles, as functions of PCM volume fraction ϕc ranging from 0 to 0.3.
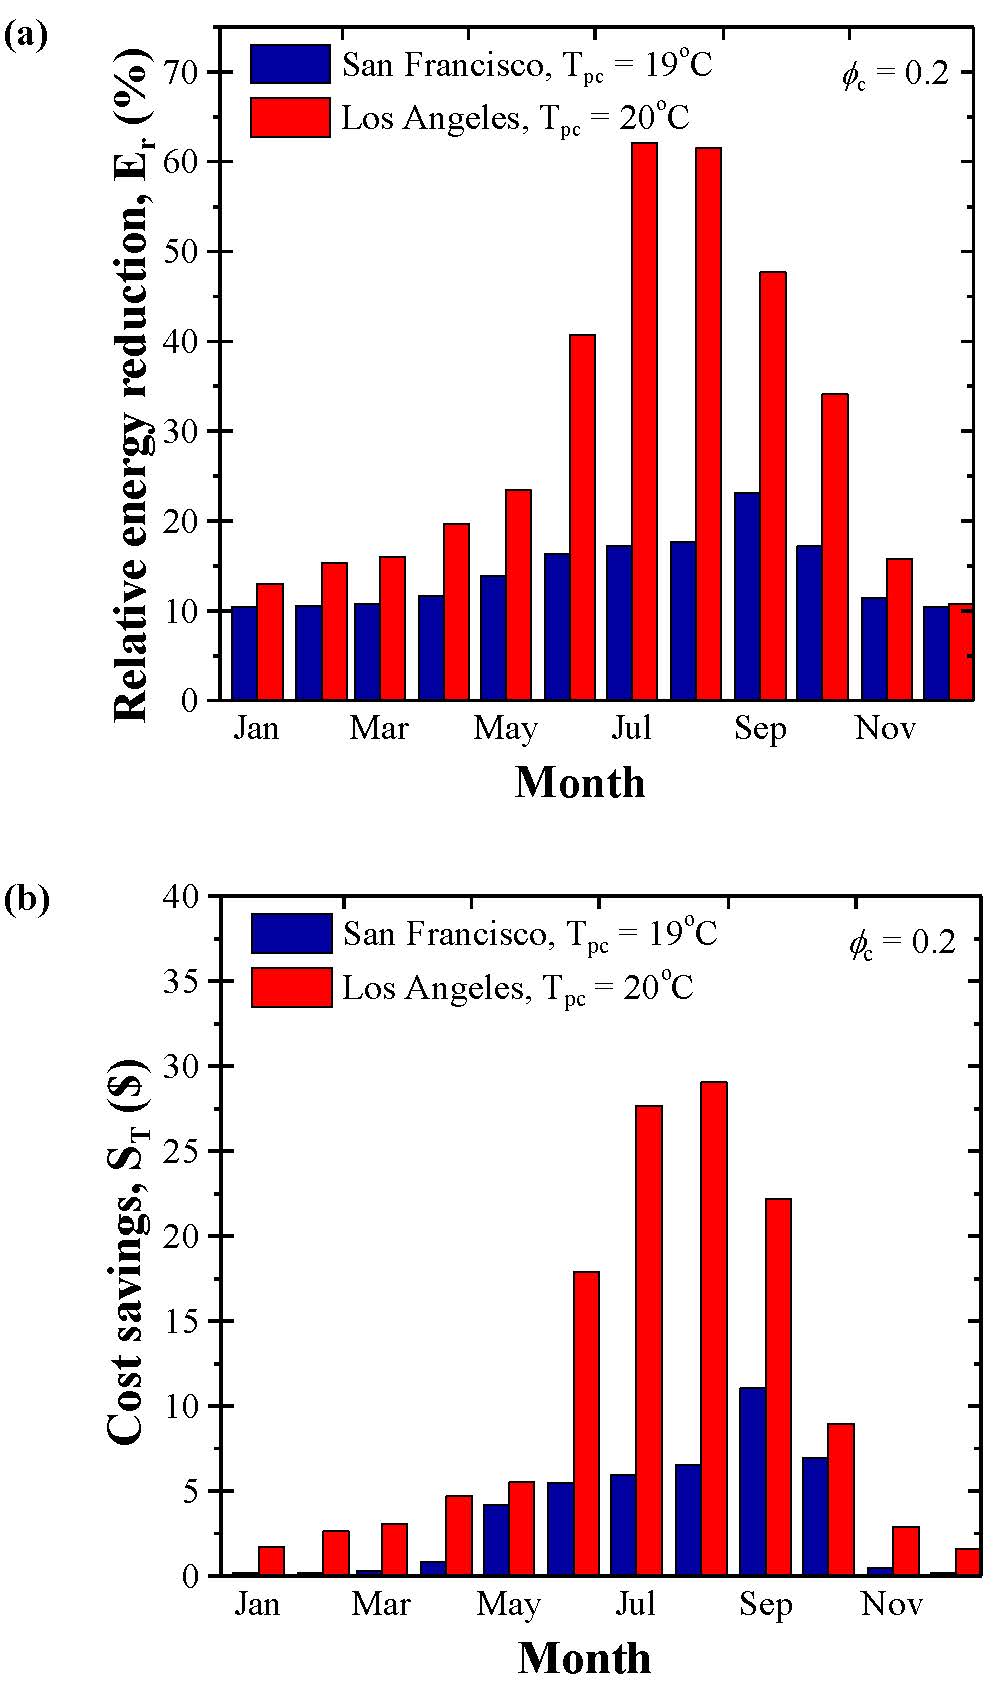
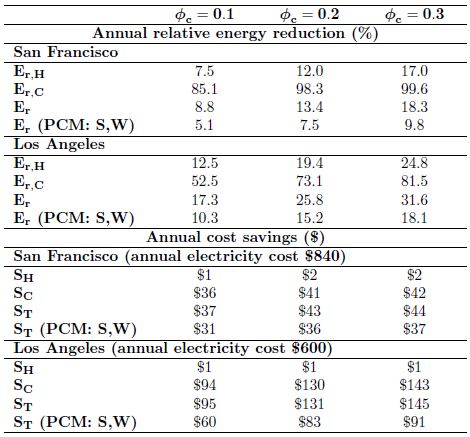
Figures 6a and 6b respectively compare Er and ST between San Francisco and Los Angeles for each month of the year for a PCM volume fraction ϕc= 0.2. Here, Tpc was taken as 19 and 20°C in San Francisco and in Los Angeles, respectively. To put these numbers in perspective, the average monthly electricity bill over all residential customers in San Francisco and in Los Angeles between 1990 and 2005 was about $70 and $50/month, respectively. Thus, adding 20 vol.% of microencapsulated PCM to the concrete walls of a single family home in Los Angeles resulted in up to ~60% cost savings in the summer months. Table 1 shows the annual relative energy reduction for heating Er,H, cooling Er,C, and total Er thermal loads and the associated annual cost savings for a typical single family home in San Francisco and Los Angeles. It also shows PCM volume fraction ϕc equal to 0.1, 0.2, and 0.3 was included either within all four walls of the home or strictly within the South- and West-facing walls as designated by (PCM: S,W). Overall, the best climate to reduce heat transfer by adding PCM to building walls is one in which the daily average outdoor temperature remains relatively close to the desired indoor temperature throughout the year, as in Los Angeles. In both cities, the annual cost savings consisted almost entirely of cooling cost savings in the form of electricity savings. The annual cost savings incurred by adding 20 vol.% microencapsulated PCM to concrete walls represented about 5 and 22% of the annual electricity expenditures in San Francisco and Los Angeles, respectively. Interestingly, the total annual cost savings ST achieved by including microencapsulated PCM only within the South- and West-facing walls was only slightly smaller than that for four walls in San Francisco. On the other hand, annual cost savings ST were substantially smaller in Los Angeles when microencapsulated PCM was included only within the South- and West-facing walls. These results suggest that the financial benefit of PCM-composite walls may be maximized in certain climates by careful and creative design choices such as the location of the PCM within the building envelope. In order to explore cost savings further, the material and implementation costs of PCM should be considered along with any incentive policies in order to assess the payback period for different PCM-composite building envelope designs.
Figure 6. Comparison of (a) the relative energy reduction Er and (b) the cost savings ST between San Francisco and Los Angeles for each month of the year for an average single family home. Here, ϕc= 0.2, hsf= 180 kJ/kg, ΔTpc= 3°C, and Tpc was taken as 19°C in San Francisco and 20°C in Los Angeles. |
Table 1. Annual heating, cooling, and total relative energy reduction Er and cost savings ST for an average single family home in San Francisco and Los Angeles for different PCM volume fractions ϕc. Here, hsf= 180 kJ/kg, ΔTpc= 3°C, and Tpc= 19°C in San Francisco and $Tpc= 20°C in Los Angeles.
|
Conclusion
This study demonstrated that adding microencapsulated PCM to the exterior concrete walls of an average-sized single family residence can lead to significant annual energy savings both in San Francisco and in Los Angeles. Overall, the annual cooling load reduction ranged from 85-100% and from 53-82% in San Francisco and in Los Angeles, respectively, as the PCM volume fraction increased from 0.1 to 0.3. The corresponding annual electricity cost savings ranged from $36-$42 in San Francisco and from $94-$143 in Los Angeles. The present study also establishes that the location of PCM within the building envelope is an important design choice, particularly from a financial standpoint. Several important design guidelines for the PCM-composite wall system were obtained:
- The annual energy reduction and cost savings were dependent on wall orientation, and were the largest for the South- and West-facing walls in the climates considered.
- The annual energy and cost savings were maximized when the phase change temperature was near the desired indoor temperature.
- Microencapsulated PCM reduces heat transfer through concrete walls the most in climates where the outdoor temperature oscillates around the desired indoor temperature.
- Adding microencapsulated PCM to the building envelop can significantly reduce the need for cooling in the hotter months in the climates considered.
- The effects of microencapsulated PCM on the energy needs for heating and the associated cost savings were small.
References
[1] Tech. Rep. GAO-04-844, Government Accountability Office, Washington DC, August 2004.
[2] J.D. Felske, Int. J. Heat Mass Transfer 47 (2004) 3453-3461.
Publications
A.M. Thiele, A. Jamet, G. Sant, and L. Pilon, 2015. Annual Analysis of Concrete-Microencapsulated PCM Composite Walls for Energy Efficient Buildings. Energy Conversion and Management, Vol. 103, pp. 374-386. doi:10.1016/j.enconman.2015.06.068 pdf