In this project, the energy harvesting capability of commercially available [001]-oriented 68PbMg1/3Nb2/3O3–32PbTiO3 (PMN–32PT) single crystal capacitors was measured experimentally. An energy density of 100 J/L/cycle, corresponding to 4.92 W/L, was obtained by successively dipping the material in oil baths at temperatures 80 and 170ºC and cycling the electric field between 2 and 9 kV/cm. Similarly, an energy density of 55 J/L/cycle was obtained between 80 and 140ºC. An estimated 40% of this energy resulted from the strain polarization due to the rhombohedral to tetragonal phase transition. The strain from this transition disappeared when the maximum operating temperature exceeded the Curie temperature of about 150ºC. The optimal low electric field used in the Olsen cycle maximizing the energy harvested was found to be around 2 kV/cm. In addition, the material suffered from (i) dielectric breakdown for electric fields larger than 9 kV/cm and (ii) cracking from thermal stress for operating temperature differences in excess of 90ºC. A physical model predicting the total amount of energy harvested was also derived, accounting for thermal expansion as well as temperature dependent dielectric constant and spontaneous polarization. The model predictions fell within 20% of the experimental results in the temperature range between 80 and 170ºC and electric fields ranging from 2 to 9 kV/cm.
![]()
For an unclamped crystal, it consists of two terms, namely (i) the primary pyroelectric coefficient accounting for changes in crystal dipole moment and (ii) the secondary pyroelectric coefficient due to dimensional changes in the crystal both caused by changes in temperature. The result of integrating the energy density equation is
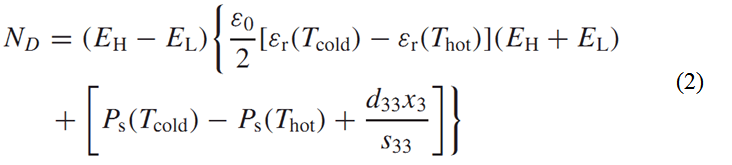
The term d33x33/s33 accounts for the secondary pyroelectric effect which is due to thermal expansion. Here, x33 is the strain resulting from the thermal expansion, d33 is the piezoelectric coefficient and s33 is the elastic compliance. By assuming the properties do not depend on temperature, the former equation reduces to one given by Sebald et al.[1].
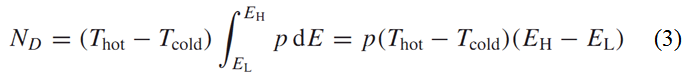
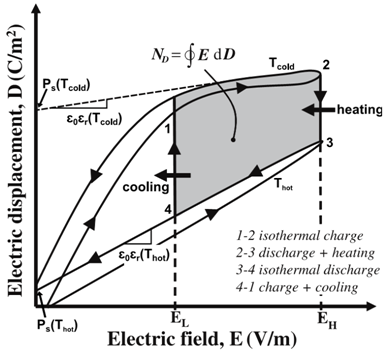
Figure 1. Electric displacement versus electric field for a typical pyroelectric material at temperatures T hot and T cold along with the Olsen cycle. The electrical energy generated per cycle is represented by the area enclosed by 1–2–3–4.
Experimental Results
The electric field EL was fixed at 2.0 kV/cm and the cold temperature Tcold was maintained at 80ºC for all experiments. The largest amount of energy harvested from this sample was 100 J/L/cycle, corresponding to 4.92 mW/cm3, obtained between temperatures Tcold = 80ºC and Thot = 170ºC and electric fields EL=2 kV/cm and EH=9 kV/cm.
Figure 2 compares the energy density obtained experimentally with of that predicted (i) by Equation (2) assuming constant properties and (ii) by Equation (3) accounting for temperature dependent properties. The constant-property model deteriorated as the temperature difference ΔT = Tcold − Tcold increased.
The effects of thermal expansion were taken into account by the temperature-dependent-property model for Thot =130 and 140ºC. However, they were neglected for Thot=150ºC as the terms x33 and d33 are negligible [2]. Figure 2 shows that reasonable agreement was found between this model’s predictions and experimental data. In fact, the relative error was less than 20% for all values of temperatures and electric fields explored. In addition, the model presented here does not require knowledge of the pyroelectric coefficient in order to calculate the energy density generated by a ferroelectric material subjected to the Olsen cycle. However, this model does not simulate the hysteresis behavior and is valid in the region where the displacement depends linearly on the electric field. This is generally the case for the Olsen cycle and indeed was the case for the experiments performed on PMN–32PT with EL larger than 2.0 kV/cm.
Figure 2. Experimentally measured energy density harvested with PMN–32PT single crystals versus high electric field EH for different values of ∆T=Thot−Tcold. The temperature Tcold was maintained at 80ºC and the low electric field EL was set at 2.0 kV/cm. The dashed and solid lines correspond to predictions by Equations (2) and (3), respectively.
Comparing D-E loops with the Olsen cycle
The strain x3 resulting from thermal expansion between 80 and 120ºC was found to be 0.11% but was negligible when no phase transition occurred [2]. Between Tcold=80ºC and Thot=130ºC, the PMN–32PT samples underwent rhombohedral to tetragonal phase transition. However, only those with Thot>TCurie transitioned from tetragonal to cubic structures.
Figure 3 shows the displacement versus electric field for bipolar hysteresis curves at temperatures Tcold=80ºC and Thot equals to 130, 140, 150, and 170ºC for electric fields EL= 3 kV/cm and EH = 6 kV/cm. It also plots the Olsen cycle operating between these two temperatures. Furthermore, it establishes that for Thot = 130 and 140ºC, the electric displacement observed during the Olsen cycle was larger than the change in displacement between the two D–E curves at temperatures Thot and Tcold. This can be attributed to the secondary pyroelectric effect which contributed about 40% of the total change in displacement. However, when Thot was set larger than TCurie = 150ºC, the strain polarization due to thermal expansion vanished. According to Li et al.[3], a [001]-poled PMN–32PT has two different strains depending on the operating conditions. When the sample is heated from 80ºC to temperature below TCurie, the strain due to tetragonal to rhombohedral phase transition is 0.11% [3]. In contrast, when the PMN–32PT is cooled from above TCurie down to 80ºC, the strain due to tetragonal to rhombohedral transition is 0.02% [3]. Increasing EH led to an increase in the amount of energy harvested as illustrated in Figure 3. This parameter was limited to 9 kV/cm corresponding to approximately the dielectric strength of the material.
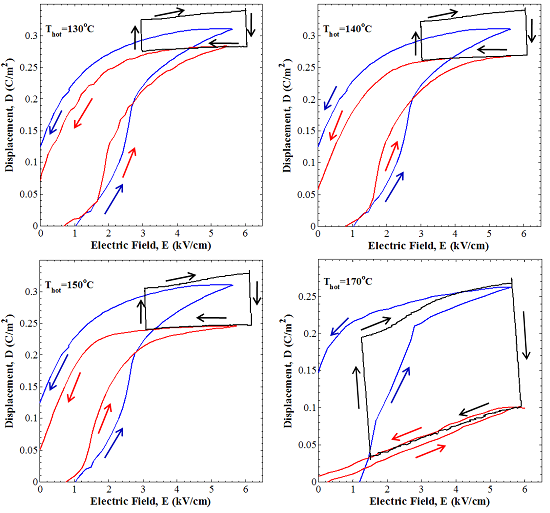
Figure 3. D–E curves and Olsen cycle performed at temperatures Tcold and Thot. Blue lines correspond to D–E curves at Tcold = 80ºC. Red lines correspond to D–E loops for Thot equal to 130, 140, 150 and 170ºC. Solid lines correspond to the Olsen cycles performed between 80ºC and Thot. The Olsen cycle is displaced to coincide with D–E curve at Thot.
Effect of electric fields EL and EH
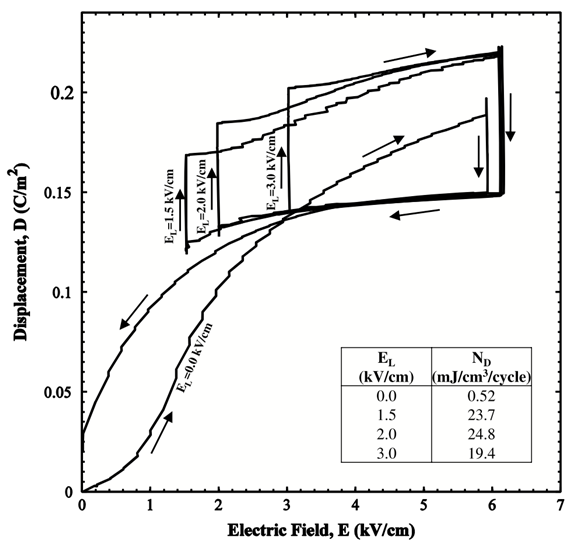
Figure 4. Experimental Olsen cycle diagrams performed on [001] poled PMN–32PT between Tcold = 80ºC and Thot = 140ºC for EH= 6 kV/cm and EL varying from 0 to 3.0 kV/cm.
Conclusion
This study presented experimental measurements of energy density generated by commercial PMN–32PT capacitors subjected to the Olsen cycle. A physical model was also derived to predict the energy density generated during the cycle. The maximum energy density harvested with PMN–32PT was found to be 100 J/L between temperatures Tcold = 80ºC and Thot = 170ºC and electric field spanning from 2.0 to 9.0 kV/cm. Future study should be performed to further validate the model and its applicability to different materials.
References
[1] Sebald G., Seveyrat L., Guyomar D., Lebrun L., Guiffard B., and Pruvost S., 2006. Electrocaloric and pyroelectric properties of 0.75Pb(Mg1/3Nb2/3)O3–0.25PbTiO3 single crystals. J. Appl. Phys., Vol. 100, pp. 124112.
[2] Yasuda N., Banno T., Fujita K., Ohwa H., Matushita M, Yamashita Y., Iwata M., and Ishibashi Y., 2007. Piezoelectric properties of relaxor ferroelectric solid solution single crystals PMN–PT and PZN–PT near MPB under pressures, Ferroelectrics Vol. 347, pp. 44–49.
[3] Li Z., Xu Z., Xi Z., Xiang F., and Yao X., 2007. Thermal expansion characteristics in [001]-oriented PMN–0.32PT single crystals, Ferroelectrics, Vol. 355, pp. 245–251.
Publications
R. Kandilian, A. Navid, and L. Pilon, 2011. Pyroelectric Energy Harvesting Capabilities of PMN-PT Near the Morphotropic Phase Boundary, Smart Materials and Structures, Vol. 20, No. 5, 055020. doi: 10.1088/0964-1726/20/5/055020.