This study reports on direct thermal to electrical energy conversion by performing the Olsen (or Ericsson) cycle on [001]-poled 0.945PbZn1/3Nb2/3O3-0.055PbTiO3 (PZN-5.5PT) single crystals. The cycle consists of two isothermal and two constant electric field processes. The energy density was found to decrease with increasing cycle frequency while the power density increased. The maximum energy density obtained was 150 J/L/cycle for temperatures between 100 and 190ºC and electric field between 0 and 1.2 MV/m at frequency 0.034 Hz. The maximum power density reached 11.7 W/L at 0.1 Hz for temperatures between 100 and 190ºC and electric fields between 0.2 and 1.5 MV/m. Moreover, the dielectric constant and saturation polarization of PZN-5.5PT are reported for the first time at 0.1 Hz for temperatures between 100 and 190ºC. Finally, the experimental results agree relatively well with predictions by a recently developed temperature-dependent property model already validated with PMN-32PT. Inter-sample variability and sample durability are also discussed.
![]()
For an unclamped crystal, it consists of two terms, namely (i) the primary pyroelectric coefficient accounting for changes in crystal dipole moment and (ii) the secondary pyroelectric coefficient due to dimensional changes in the crystal both caused by changes in temperature. The result of integrating the energy density equation is
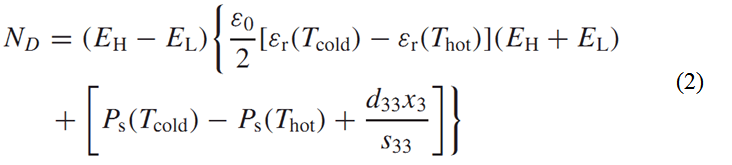
The term d33x33/s33 accounts for the secondary pyroelectric effect which is due to thermal expansion. Here, x33 is the strain resulting from the thermal expansion, d33 is the piezoelectric coefficient and s33 is the elastic compliance.
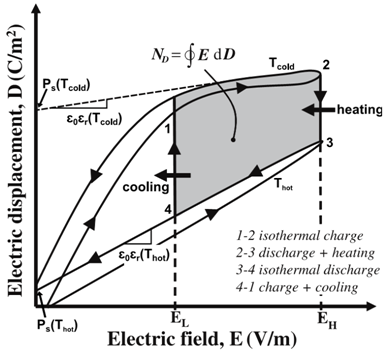
Figure 1. Electric displacement versus electric field for a typical pyroelectric material at temperatures Thot and Tcold along with the Olsen cycle. The electrical energy generated per cycle is represented by the area enclosed by 1–2–3–4.
Experimental Results
Isothermal bipolar displacement versus electric field hysteresis curves were collected at various temperatures by applying a triangular voltage with frequency of 0.1 Hz across the single crystal samples. Moreover, the saturation polarization Ps(T) and the dielectric constant εr(T) of each sample at temperature T were evaluated by linearly fitting the section of the bipolar D-E loops corresponding to relatively large electric field decreasing from 1 to 0.5 MV/m.
The Olsen cycle was performed on the PZN-5.5PT samples for (i) different values of low and high electric fields EL and EH, (ii) various hot operating temperature Thot, and (iii) various cycle frequency f. The cold operating temperature Tcold was fixed at 100ºC. The hot operating temperature was varied from 125 to 190ºC. The electric fields EL and EH ranged from 0 to 0.2 MV/m and from 0.5 to 1.5 MV/m, respectively.
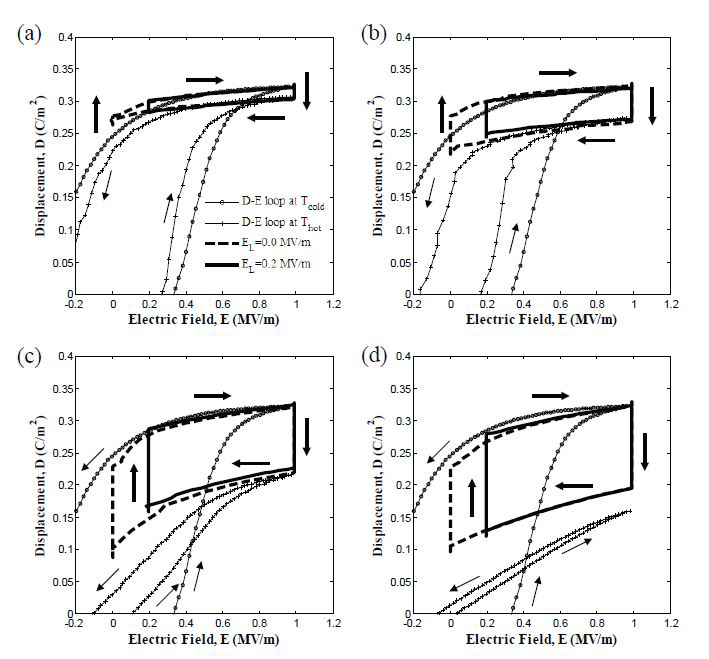
Figure 2. Isothermal bipolar D-E loops and experimental Olsen cycles at EL=0.0 and 0.2 MV/m for PZN-5.5PT (Sample 5) with Tcold=100oC and EH=1.0 MV/m for Thot equal to (a) 125ºC, (b) 150ºC, (c) 175ºC, and (d) 190ºC.
Effect of Frequency
The overall cycle frequency was defined as f = 1/(.τ12 + τ23 + τ34 + τ41) where τ.ij corresponds to the duration of process i-j. It varied from 0.021 to 0.15 Hz by changing the duration of the isoelectric field heating and cooling processes 2-3 and 4-1 denoted by τ23 and τ41 (Figure 1). However, the time rate of change of the electric field during the isothermal processes 1-2 and 3-4 remained the same at 0.4 MV/m/s.
First, it is interesting to note that the Olsen cycles measured at frequencies of 0.021 Hz and 0.034 Hz overlapped. Indeed, for these frequencies, the electric displacement had reached steadystate, i.e., ∂D/∂t = 0, before the electric field was varied. In this case, processes 1-2 and 3-4 followed a relatively smooth path, indicating that the four different processes in the Olsen cycle were performed under quasiequilibrium conditions.
Moreoever, for cycle frequencies larger than 0.034 Hz, the isoelectric field processes 2-3 and 4-1 were not performed under quasiequilibrium conditions. For such cycle frequencies, the electric displacement had not reached steady-state before the electric field was varied to perform processes 1-2 and 3-4. In other words, the phase transition was incomplete. In addition, the Olsen cycles did not follow a smooth path between EL and EH during processes 1-2 and 3-4 in the D-E diagram, as illustrated in Figure 4.
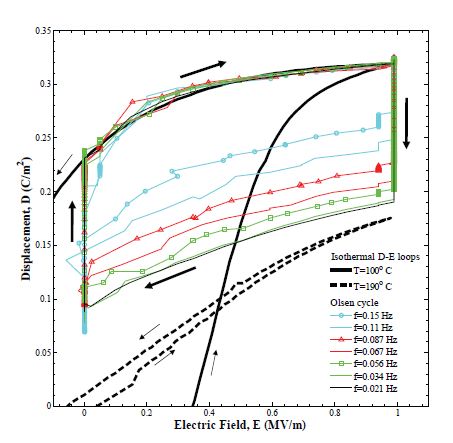
Figure 4. D-E diagram of isothermal bipolar D-E loops and experimental Olsen cycles at various frequencies for PZN-5.5PT (Sample 4). The temperatures Tcold and Thot were maintained at 100 and 190ºC, respectively and the low and high electric fields EL and EH were set at 0.0 and 1.0 MV/m, respectively
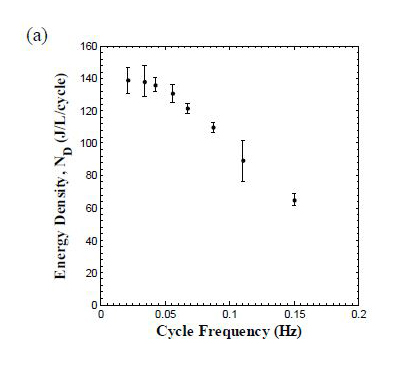
The energy density reached a plateau of 140 J/L/cycle at frequencies below 0.034 Hz and decreased with increasing cycle frequency. Reducing the cycle frequency below 0.034 Hz, by increasing the duration of the isoelectric field processes 2-3 and 4-1, did not result in larger energy density because each process of the Olsen cycle was in quasiequilibrium. Conversely, the power density increased with increasing frequency and reached a maximum of 10.1 W/L at 0.1 Hz. For frequencies larger than 0.1 Hz, PD decreased with increasing frequency. This can be explained by considering the expression PD = ND(f)f. For frequencies less than 0.1 Hz, the decrease in ND(f) was compensated by the raise in frequency so that PD increased. However, beyond 0.1 Hz, ND decreased significantly with frequency resulting in smaller values of PD. In practice, the operating frequency could be adjusted according to the power needed for a given load.
 |
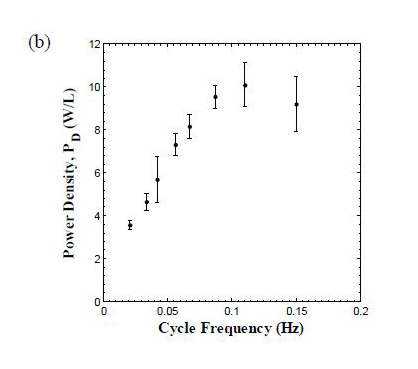 |
Figure 5. Experimentally measured (a) energy density and (b) power density generated with PZN-5.5PT single crystal (Sample 4) as a function of cycle frequency. The temperatures Tcold and Thot were maintained at 100 and 190ºC, respectively. The low and high electric fields EL and EH were set at 0.0 and 1.0 MV/m, respectively.
Model Predictions
Figure 8. Experimentally measured energy density generated at 0.034 Hz from PZN-5.5PT single crystal (Sample 5) versus high electric field EH for Thot equal to (a) 125ºC, (b) 150ºC, (c) 175ºC, and (d) 190ºC. The temperature Tcold was maintained at 100ºC and the low electric field EL was set at 0.2 MV/m. The solid line corresponds to predictions by Equation (2) using properties retrieved from isothermal D-E loops.
Conclusion
This study presented experimental measurements of energy and power densities generated by performing the Olsen cycle on [001]-poled PZN-5.5PT single crystals. It showed that as the cycle frequency increased, the energy density decreased while the power density increased up to 0.1 Hz when it reached a peak. For temperatures Tcold=100ºC and Thot=190ºC and electric fields between 0.2 and 1.5 MV/m the power densities reached a maximum of 11.7 W/L at 0.1 Hz. The maximum energy density achieved was 150 J/L at frequency 0.034 Hz for Tcold=100ºC, Thot=190ºC, EL=0.0 MV/m, and EH=1.2 MV/m. Sample variability was relatively small. It was the largest around 125ºC due to variation in the rhombohedral/tetragonal volume fraction among samples and around 175ºC due to difference in Curie temperature. Moreover, the dielectric constant and saturation polarization of PZN-5.5PT are presented in Table 1 for temperatures between 100 and 190ºC at 0.1 Hz. Finally, the results confirmed the validity of a recently developed model [1] predicting the energy density generated from ferroelectric single crystals using the Olsen cycle under quasiequilibrium conditions.
References
[1] R. Kandilian, A. Navid, and L. Pilon, 2011. Pyroelectric Energy Harvesting Capabilities of PMN-PT Near the Morphotropic Phase Boundary, Smart Materials and Structures, Vol. 20, No. 5, 055020. doi: 10.1088/0964-1726/20/5/055020.
Publications
I.M. McKinley, R. Kandilian, and L. Pilon, 2012. Waste Heat Energy Harvesting Using Olsen Cycle on 0.945 Pb(Zn1/3Nb2/3O3-0.055 PbTiO3 Single Crystals, Smart Materials and Structures, Vol. 11, No.3, 035015. doi:10.1088/0964-1726/21/3/03501