Abstract
This study aims to elucidate the respective contributions of faradaic reactions and electric double layer formation to charge storage in hybrid pseudocapacitors. It also aims to provide physical interpretation of experimental cyclic voltammetry (CV) measurements. First, a physicochemical transport model was derived from first-principles for simulating coupled interfacial, transport, and electrochemical phenomena in hybrid pseudocapacitors. The model simultaneously accounted for (i) charge transport in both electrodes and electrolyte, (ii) the dynamics of the electric double layer, (iii) steric repulsion due to finite ion sizes, (iv) redox reactions, and (v) intercalation. Then, CV curves were simulated for different electrode thicknesses and Li+ diffusion coefficients in the planar pseudocapacitive electrode. Particular attention was paid to the so-called b-value characterizing the power law evolution of the total current with respect to scan rate for a given potential. Overall, trends observed in numerically generated CV curves showed good agreement with experimental measurements. In addition, the results indicated that a b-value of unity across the potential window can be associated with purely faradaic charge storage with fast ion intercalation in the thin-film pseudocapacitive electrode. The study also demonstrates that under diffusion-limited conditions of Li+ intercalation in the pseudocapacitive electrode, the CV curves exhibited two distinct regimes: a faradaic regime dominated by faradaic reactions and a capacitive regime dominated by electric double layer formation. The b-value was near 1.0 in both regimes. However, a dip in the b-value, often observed experimentally, was also obtained and attributed to the transition between the capacitive and the faradaic regimes.
Analysis
Schematic and Assumptions
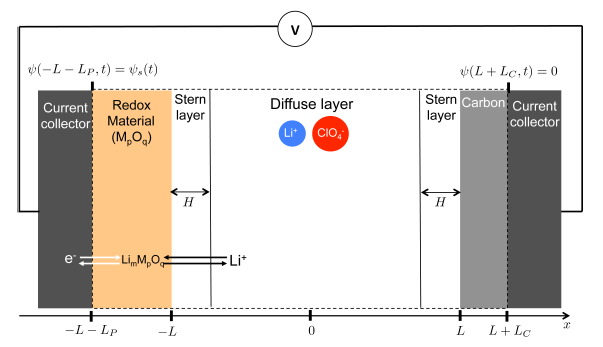
- Electrodiffusion of Li+ and ClO4- ions in the electrolyte and insertion (or intercalation) of Li atoms in the electrode were one-dimensional.
- The Stern layer thickness H was approximated as the radius of the largest solvated ion species, namely ClO4-.
- The diffusion coefficients of all ion species in the electrolyte and that of Li in the redox-active electrode were independent of their respective concentrations.
- Isothermal conditions prevailed throughout the device.
- Advection in the electrolyte was negligible.
- The reversible redox reaction was heterogeneous and occurred at the electrode/electrolyte interface near the pseudocapacitive electrode.
- The intercalation and deintercalation of Li+ atoms into and out of the pseudocapacitive electrode were treated as diffusion processes.
- The redox-active material did not undergo any phase transition.
- The electrical conductivity and the Li+ diffusion coefficient of the pseudocapacitive electrode were constant.
- The specific ion adsorption due to non-electrostatic forces was assumed to be negligible.
- The potential drop across the highly conducting current collectors was negligible so that only the electrodes and electrolyte domains were simulated.
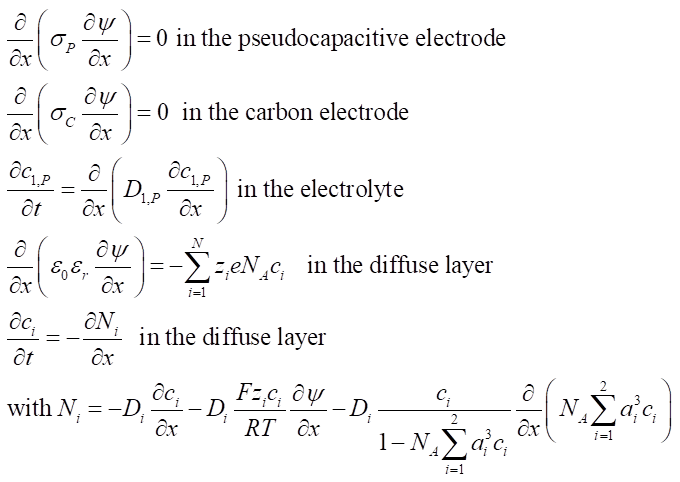
Governing equations
The local electric potential ψ(x,t) in the pseudocapacitive (subscript P) and carbon (subscript C) electrodes and the ion concentrations ci(x,t) in the electrolyte and electrode are governed by the one-dimensional Modified Poisson-Nernst-Plank model expressed as
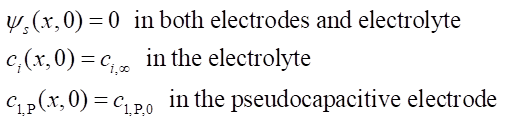
Initial conditions
Boundary conditions
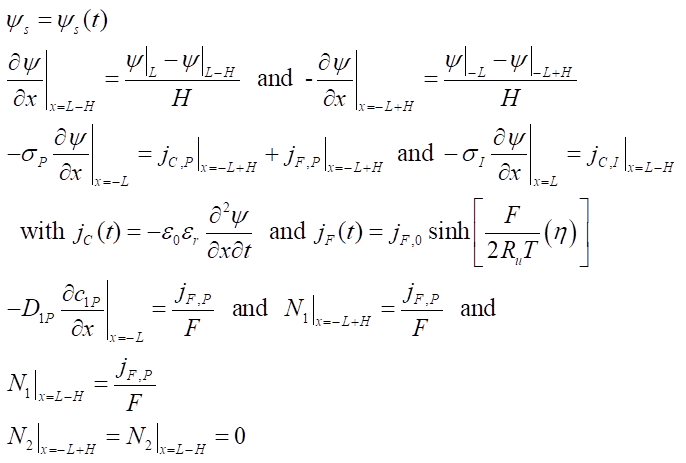
Constitutive relationships
Here, the reaction rate constant was k0 = 10-8 (m/s) (mol/m3)-1/2 and no significant potential drop occured across the redox layer thanks to a electrical conductivity σP = 10-5 S/m.
Results and Discussion
To study the effects of the pseudocapacitive electrode properties on the performance of a hybrid pseudocapacitor, two limiting cases were defined.
- Case A corresponded to a thin-film pseudocapacitive electrode with fast Li+ intercalation
- Case B corresponded to a thick pseudocapacitive electrode with slow Li+ intercalation
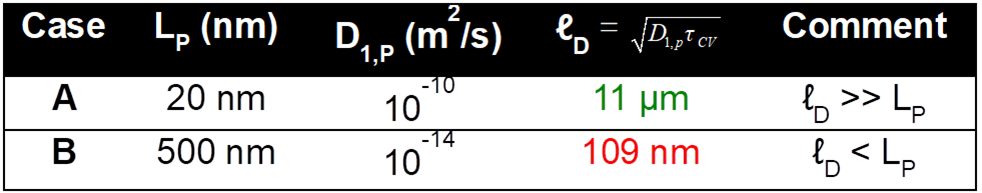
Figure 1a indicates that the CV curve jT vs. ψs featured a peak in both charging, for decreasing ψs, and discharging, for increasing ψs, currents around ψs = 0 V. Figure 1a also shows that the faradaic current dominated during the entire cycle and the capacitive current was negligible. This can be attributed to fast redox reactions and intercalation of Li atoms in the thin electrode. Indeed, the large reaction rate guaranteed that Li+ ions at the Stern/diffuse layer interface were consumed by the redox reaction during charging. In addition, the large diffusion coefficient of Li+ ions in the electrolyte ensured sufficient supply of Li+ during charging. Similarly, the large diffusion coefficient of Li+ in the pseudocapacitive electrode ensured sufficient supply of Li atoms to be oxidized at the electrode/electrolyte interface during discharging. Then, no significant capacitive current resulting from EDL formation was observed. In contrast to Case A (Figure 1a), Figure 1b shows that, for slow Li+ diffusion in a thick electrode, the faradaic current jF dominated only in the lower end of the potential window while the capacitive current jC dominated in the higher end during both charging and discharging. In addition, the total current jT and the integral capacitance were smaller in Case B than in Case A for the same v = 1 V/s. In Case B, the CV curve featured three peaks in the total current: at ψs = 0 V in both the charging and the discharging phase, and at ψs = -0.15 V in the charging phase.
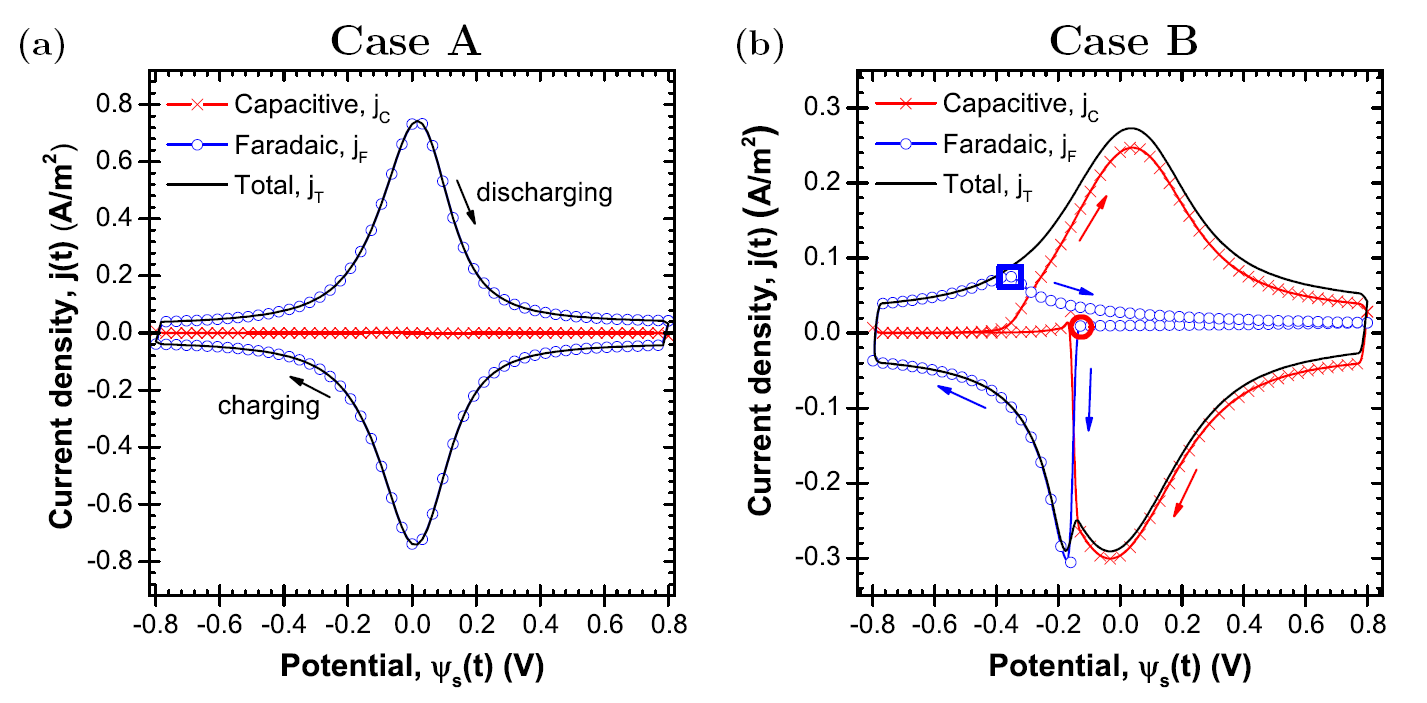
Fig. 1. Capacitive jC, faradaic jF, and total jT current densities versus cell potential for a scan rate v = 1 V/s for (a) Case A and (b) Case B.
Fig. 2a indicates that, in the case of a thin electrode with fast intercalation (Case A), the CV curves were similar in shape with the total current density jT(ψs) increasing with scan rate. This suggests that the cell was not limited by diffusion of any species for the range of scan rates considered. Fig. 2b shows that, the peaks and humps apparent during charging shifted to lower potential ψs as the scan rate v increased. Note that this was consistent with experimental observations of Li+ insertion in nanocrystalline films of orthorhombic Nb2O5 [3] or in TiO2 anatase [4].
Fig. 2c shows that, for Case A, the total current jT increased linearly with scan rate v for ψs = -0.4 V and +0.4 V. The same observation was made for all potentials across the potential window including the current at the charging peak, also known as cathodic peak. On the other hand, Fig. 2d indicates that, for Case B, the evolution of the total current density jT(t) with the scan rate v depended on the potential considered.
Fig. 2e indicates that for Case A, the b-value was independent of ψs and close to unity across the potential window. Note that the faradaic current with fast intercalation dominated for all potentials (Fig. 2a). Thus, these results indicate that a b-value of unity can be associated with fast reversible faradaic reaction in thin electrodes. Then, the faradaic current jF was proportional to the scan rate v, as also observed in EDLCs. Thus, this behavior can be referred to as "capacitive behavior". However, the charge storage mechanism is truly faradaic and not capacitive. By contrast, for Case B, Fig. 1f indicates that the b-value featured a drop from 1 to about 0.6, as often observed in experimental studies of pseudocapacitors [2,4,5]. The dip in the b-value has often been attributed to the intercalation process on the basis that jT was proportional to v1/2 for reversible redox reactions with semi-infinite diffusion of the reaction products and in the absence of electric double layers [6]. However, the dip in the b-value predicted numerically did not occur during the faradaic regime but for -0.2 V < ψs < 0 V corresponding to the transition between the capacitive and faradaic regimes.
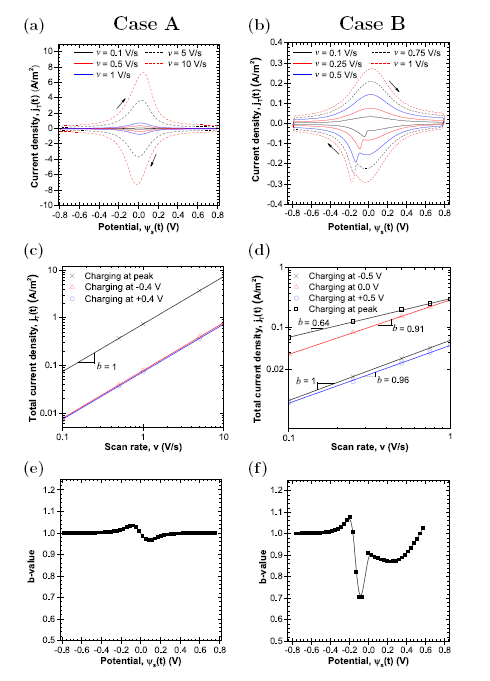
Fig. 2. CV curves for multiple scan rates for (a) Case A and (b) Case B. Total current density jT as a function of scan rate v in log scale for a selection of imposed potentials ψs(t) for (c) Case A and (d) Case B. Computed b-value as a function of imposed potential for (e) Case A and (f) Case B using the charging current for all scan rates shown in (a) and (b) respectively. The regression coefficient R2 obtained in the fitting of the b-value was larger than 0.95 for all values of ψs.
Conclusions
- For fast intercalation in a thin electrode the current was always due to the faradaic reaction and the b-value was unity across the potential window.
- For relatively thick electrodes and/or slow intercalation, the CV curves exhibited two distinct regimes.
- A faradaic regime prevailed for the more negative potentials and was dominated by the faradaic reaction and limited mainly by the diffusion of Li+ in the pseudocapacitive electrode during discharge.
- A capacitive regime dominated at larger potentials with current due to the formation of an EDL at the electrode surface.
- A b-value of unity was associated with both regimes. The dip in b-value occured during the transition between these two regimes.
References
[1] H. Lindström et al. The Journal of Physical Chemistry B 101.39 (1997): 7717-7722.
[2] J. Wang et al. The Journal of Physical Chemistry C 111.40 (2007): 14925-14931.
[3] V. Augustyn et al., Nature materials, 12.6 (2013): 518-522.
[4] H. Lindström et al., The Journal of Physical Chemistry B 101.39 (1997): 7717-7722.
[5] M. Zukalova et al.,Chemistry of Materials 17.5 (2005): 1248-1255.
[6] A. J. Bard and L.R. Faulkner. Electrochemical Methods 2 (2001).
Publications
H.-L. Girard, H. Wang, A.L. d'Entremont, and L. Pilon, 2015. Physical Interpretation of Cyclic Voltammetry for Hybrid Pseudocapacitors, Journal of Physical Chemistry C, Vol. 19, No. 21, pp. 1349-11361. doi: 10.1021/acs.jpcc.5b00641 pdf