Figure 1 depicts a flow chart of raw energy consumed in the United States in 2002 in quads (10 15 Btu) [1]. It shows that only 36.2% of the energy contained in raw energy sources (e.g., petroleum, natural gas, and coal) was useful for residential, commercial, industrial or transportation uses. However, 57.8% was wasted mainly in the form of heat. In the transportation sector, only 20% of the energy consumed was useful while the remaining 70-80% was lost through the tailpipe or the radiator in vehicles, for example. Since the need for energy is increasing, it would be beneficial to the society to harvest this waste heat by converting it into usable electrical energy.
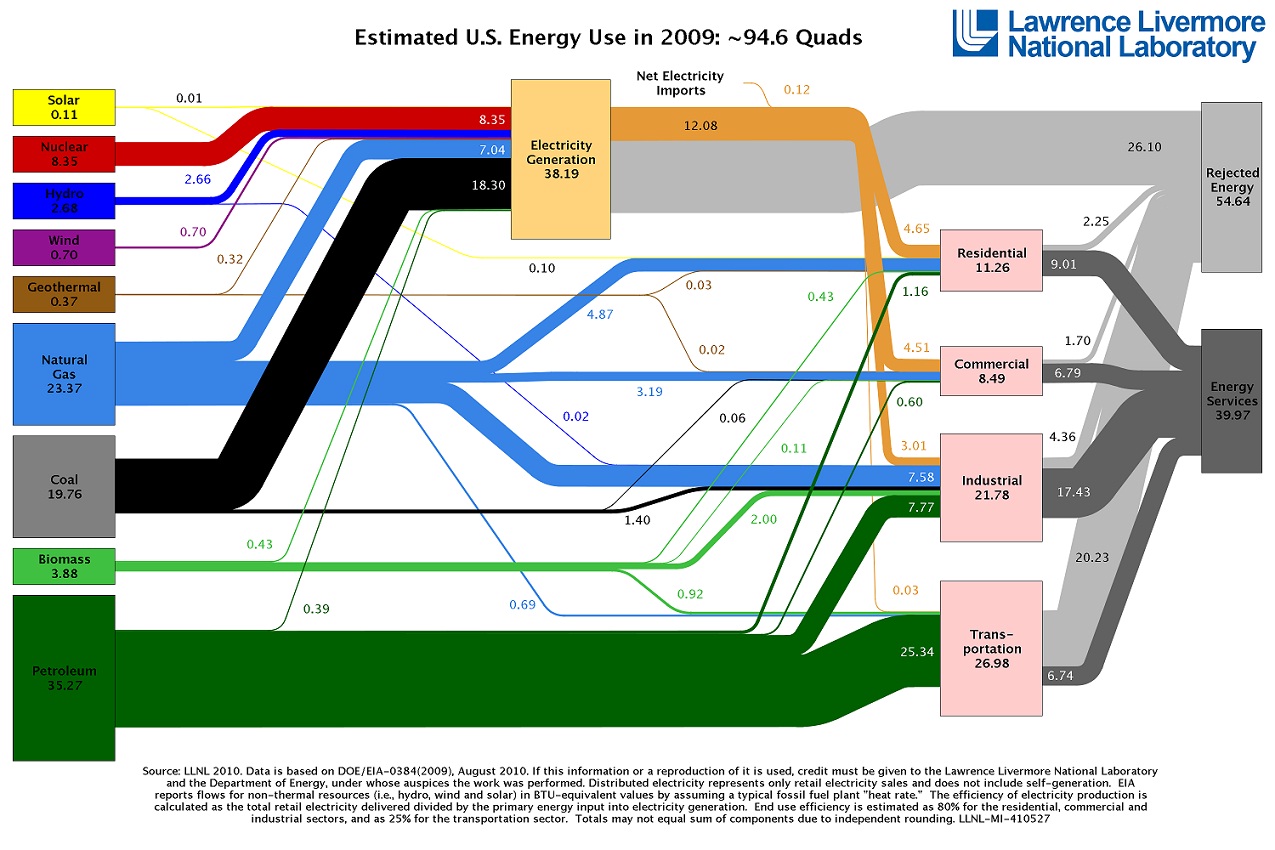
Figure 1. Flow chart of the energy produced, used, and wasted in the United States in 2009 (unit in quads) [1].
Principle
Pyroelectric Effect
Pyroelectric materials are materials whose spontaneous polarization P presents strong temperature dependence due to their crystallographic structure.
(a) A pyroelectric sample by itself where free charges (represented as positive and minus circles) are attracted to the material due to its spontaneous polarization.
(b) The sample with electrodes that are connected to an ammeter at constant temperature. The spontaneous polarization is constant and no current is flowing.
(c) The sample with electrodes that are connected to an ammeter while being heated. The spontaneous polarization is reduced (as portrayed by the length and thickness of arrow P) through reduction in the dipole moment (represented as the orientation of the rectangles within the material). The result is that the quantity of bound charges at the electrodes decreases, and the subsequent redistribution of charges results in current flowing through the external circuit.
(d) The sample with electrodes that are connected to an ammeter while being cooled. The spontaneous polarization is increased, and the current sign is reversed.
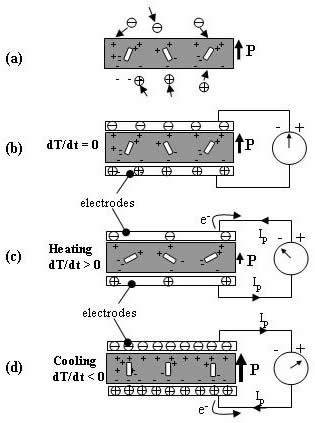
Figure 2. Schematic of a pyroelectric sample (a) by itself and with electrodes and connected to an ammeter (b) at constant temperature, (c) while being heated, and (d) while being cooled (adapted from Lang [2]).
Olsen Cycle [3,4]
Figure 3 shows the charge versus voltage curve for a pyroelectric material (PZST) at constant temperatures. Notice a hysteresis behavior in the material where the charge when the voltage is increased is different than that when the voltage is decreased.
The Olsen cycle is represented by the cycle 1-2-3-4 in Figure 3.
- Process 1-2: increase electric field at constant cold temperature
- Process 2-3: increase temperature at constant high electric field
- Process 3-4: decrease electric field at constant high temperature
- Process 4-1: decrease temperature at constant low electric field
The shaded area in Figure 3 represents the work generated from the cycle given
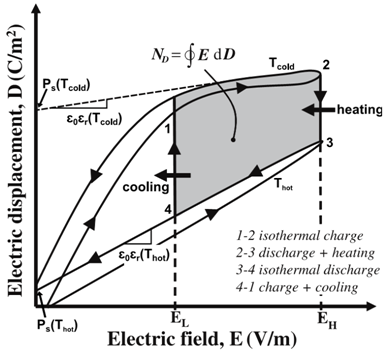
Figure 3. Electric displacement versus electric field for a typical pyroelectric material at different temperatures. The Olsen power cycle is represented by the area between 1-2-3-4.
Pyroelectric energy converters offer a novel, direct energy conversion technology by transforming time-dependent temperatures directly into electricity. The objectives of our efforts in this area include
- Systematically characterize pyroelectric materials (ceramics, single crystals, polymers) for their energy conversion capabilities
- Model material behavior and predict their energy conversion capabilities from first principles.
- Numerically simulate prototypical pyroelectric converters in order to identify the best heat transfer mechanisms, key design and operating parameters to increase the power output and the thermodynamic efficiency of the device.
- experimentally assemble a pyroelectric energy converter to directly convert harvest waste heat into useful electrical energy.
[1] Lawrence Livermore National Laboratory, "Estimated U.S. Energy Use In 2009"
[2] S.B. Lang., Pyroelectricity: from ancient curiosity to modern imaging tool, Physics Today 58 (8) (2005) 31-36.
[3] R.B. Olsen, D.A. Bruno, and J.M. Briscoe, “Cascaded pyroelectric energy converter", Ferroelectrics, vol. 59, pp. 205-219, 1984.
[4] R.B. Olsen, D.A. Bruno, and J.M. Briscoe, “Pyroelectric conversion cycle of vinylidene fluoride-trifluoroethylene copolymer", Journal of AppliedPhysics, vol. 57, pp. 5036-5042, 1985