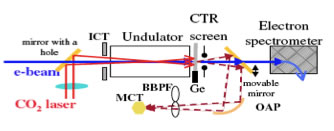
Figure 3-1. Experimental set-up for the harmonicmicrobunching experiment in Neptune. The CO2 laser frequency is at the 7th harmonicof the fundamental frequency of the undulator radiation. The 12 MeV electron beam is microbunched and producesharmonics ofthe CO2 radiation via coherenttransition radiation (CTR), which is detected on the mercury cadmium telluride (MCT) detector.
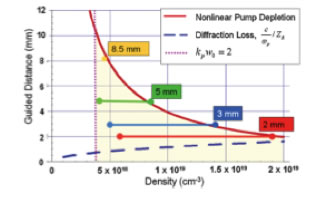
Figure 3-2. Summary guided length vs. density for different gas-jet lengths where self-guiding was observed by imaging the transmitted laser light from the plasma. The solid red curve is the plot of the 1/ne scaling predicted by the nonlinear pump depletion expression. The dotted blue line is the predicted guided distance if the laser pulse diffracts c/wp per Rayleigh length, ZR. The vertical dashed line is approximately the minimum density where refraction balances the diffraction of our small laser spot.
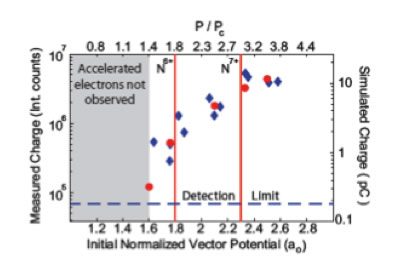
Figure 3-3. Experimental evidence for ionization induced trapping in a plasma wake. The measured electron charge with energy greater than 25 MeV rapidly increases once the threshold for ionizing the 6th electron of Nitrogen is approached in a 9:1 He:N2 gas mix. The blue diamonds are experimental points and the red dots are simulation points. Simulations revealed that the “early” onset of N+6 injection (to the left of the red N+6 line) is due to self-focusing.
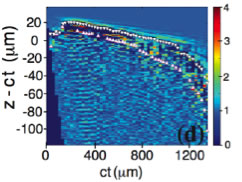
Figure 3-4. The position of the first and the second accelerating bucket (dotted lines) of the wakefield as a function of time. The initial slope is close to the linear group velocity of the laser pulse in the plasma. At later times as the laser pulse becomes pump depleted it propagates at a slower velocity as evidenced by the accelerating buckets slipping backward in the (z-ct) frame.
Current Research
Harmonic microbunching of 12 MeV electrons in a 7th order IFEL
In an experiment carried out in the Neptune Lab we showed that a seventh order IFEL interaction, where the radiation frequency is the seventh harmonic of the fundamental resonance frequency for FEL effect, can microbunch a beam of relativistic electrons insie the undulator itself. Furthermore this bunching can be very strong as witnessed by coherent transition radiation (CTR) produced by the bunched beam at the third harmonic of the radiation frequency. These results are important because this method offers an extra degree of flexibility in designing microbunchers for future acceleration concepts and short wavelength FELs.
Self-guiding of intense but ultra-short laser pulses for LWFA
We have carried out a comprehensive study of self-guiding of laser pulses that are both short and intense enough to excite extremely nonlinear wakefields in plasmas. Our work has shown that such laser pulses can be stably guided over tens of Rayleigh lengths at plasma densities of interest to give GeV class electron beams. This work formed the thesis topic of Joe Ralph. We show that in the so-called blowout regime, the maximum distance over which the short laser pulse is guided is determined by the nonlinear pump depletion length; i.e., not by the beam-head erosion rate, of c/wp per Rayleigh length due to diffraction, as had been commonly believed. This work was critical to the formation of a new collaboration with the Livermore group described later.
Ionization induced trapping in a laser wakefield accelerator
We have systematically studied ionization induced trapping to improve the reliability of the electron trapping process in a LWFA at low plasma densities and to reduce the laser power needed to obtain the onset of trapping. In this method a minority species of a medium Z gas such as N is added to the majority species, He gas. The two He electrons and the outer 5, L-shell N electrons are easily ionized by the rising edge of the laser pulse and form the wake. The wake potential however is not sufficient to self-trap the blown out plasma electrons that form the thin sheath of the wake structure. As the laser intensity nears its peak, however, the K shell electrons of N are ionized. Since these electrons are ionized inside the wake they can more easily be trapped by the wake potential. This work formed the basis of student A. Pak’s PhD thesis.
Laser pump depletion effect on the phase velocity of the wake
When a laser pulse excites a wakefield it undergoes spectral modification. In particular the laser photons in the decelerating part of a wake can be frequency downshifted. Consequently the group velocity of the laser pulse and hence the phase velocity of the wake can also slow down. This in turn implies that the relativistic Lorentz factor of the wake will decrease as the pulse propagates through the plasma. The effect is most severe as the laser pulse approaches the pump depletion limit where it is no longer able to excite a strong wakefield. We have measured this subtle but important effect by employing a 50 fs resolution framing diagnostics that gives the position of the wakefront as a function of time. Using this method we can measure a few percent changes in the nearly speed of light propagation velocity of the wake. This work formed the PhD thesis topic of Fang Fang.
IFEL-FEL prebunchers for a plasma accelerator
In 2006 we established a collaboration with STI Optronics to develop suitable undulators for building THz microbunchers using the FEL/IFEL mechanism. Such undulators can also be used to generate 10s of MW of THz radiation in an FEL or to accelerate electrons in an IFEL. The FEL requires a week seed but either a much longer undulator or a prebunched, high current beam. The IFEL requires a much shorter undulator but a more powerful THz beam. Student Chieh Sung did his PhD thesis work in optimizing both schemes and specifying the undulators. These have now been built by STI under a Phase II SBIR award and have recently been delivered to UCLA. We have shown that by using non-collinear difference frequency mixing in GaAs, we can generate tunable THz seed radiation in the 100 W-1 KW power range in the 100-300 micron wavelength range. Furthermore this radiation is phase locked to the CO2 laser that is used as a pump laser. Thus the micro-bunched electron can be phase locked to a plasma accelerating structure such a plasma beat wave accelerator excited by the CO2 radiation. This remains our medium term research plan in Neptune.
Quasi phase matched GaAs structure for collinear THz seed generation
The generation the seed THz radiation for microbunching experiments would be more robust if the difference frequency mixing could be achieved in a collinear geometry. We have therefore developed and successfully tested for the first time a large aperture, quasi-phased matched GaAs structure using a new bonding technique that uses teflon as the interface material. This work formed student Sarah Trubnick’s M.S. thesis.