This study aims to develop a model for simulating the electric double layer dynamics in CV measurements while simultaneously accounting for transport phenomena in both the electrode and the electrolyte. It also aims (i) to identify the dimensionless parameters that govern the CV measurements, (ii) to provide a physical interpretation of the shape of CV curves, and (iii) to investigate the effect of the electrode electrical conductivity on the predicted double layer capacitance. The transient double layer dynamics was simulated using the modified Poisson-Nernst-Planck (MPNP) model with a Stern layer and accounting for the presence of the electrode.
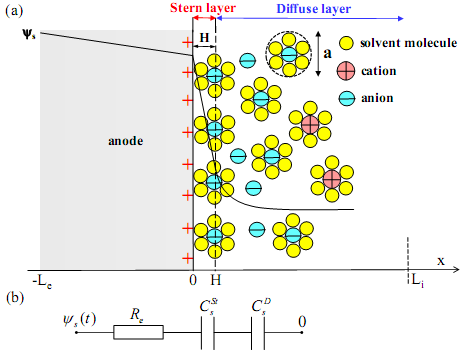
Figure 1a shows a schematic of the electric double layer structure forming near the surface of an anode. Solvated cations of diameter a migrate and adsorb to the electrode surface due to electrostatic forces. The Stern layer is defined as the compact layer of immobile ions strongly adsorbed to the electrode surface. Note that there are no free charges within the Stern layer. Beyond the Stern layer is the so-called diffuse layer where ions are mobile under the coupled influence of electrostatic forces and diffusion. Figure 1b shows the electric circuit representation of an electric double layer capacitance including the electrode resistance, the Stern layer and diffuse layer capacitances in series. CV measurements consist of imposing an electric potential at the electrodes which varies periodically and linearly with time. The resulting electric current is recorded. The total charge accumulated at the electrode surface can be found by integrating the electric current with respect to time. Then, the capacitance can be estimated as the total charge divided by the "potential window". Capacitance is typically measured at different scan rates to characterize the performance of energy storage devices such as electric double layer capacitors (EDLCs). The capacitance measured at low scan rates is maximum and close to the capacitance under equilibrium conditions. Moreover, the shape of CV curves has been used extensively to deduce the electrochemical processes involved in the charging and discharging of EDLCs. For example, the current initially increases when charging EDLCs from zero potential. Then, it decreases upon further increase in the electric potential. Thus, a ``hump'' is typically observed in the CV curves. Different interpretations have been proposed in the literature to explain this observation. |
Fig. 1. Schematic of (a) the electric double layer structure showing the arrangement of solvated anions and cations near an anode/electrolyte interface and the simulated computational domain consisting of the Stern layer and the diffuse layer, (b) the electrode resistance along with the Stern and diffuse layer capacitances in series. |
The local electric potential ψ(x,t) and ion concentrations ci(x,t) at time t and location x in the electrolyte solution were computed by solving the MPNP model with a Stern layer given by,
The boundary and initial conditions are given by,
The following parameters were introduced to make the governing equations and boundary conditions dimensionless,
|
Then, the dimensionless governing equations and boundary/initial conditions can be written as, |
Overall, four dimensionless numbers were identified as,
![]()
Figure 2a shows the predicted current density js versus surface potential ψs (js-ψs curves) obtained from CV simulations for three cases featuring different values of T, Li, a, c∞, D, v, and ψmax. However, the dimensionless numbers for all cases were identical, namely, Π1 =19.47, Π2 =0.0038, Π3 =64, and Π4= ∞. Results were obtained by numerically solving the MPNP model with a Stern layer without electrode, i.e., Le=0 nm. Figure 2a shows that the predicted js-ψs curves were significantly different for these three cases. However, Figure 2b demonstrates that the dimensionless j*s-ψs* curves overlapped after using the scaling parameters. Overall, these results demonstrate that (i) the scaling parameters introduced here and the dimensional analysis for CV simulations were valid and (ii) the double layer charging dynamics near planar electrodes in CV measurements was governed by four dimensionless numbers, i.e.,Π1, Π2, Π3, and Π4.
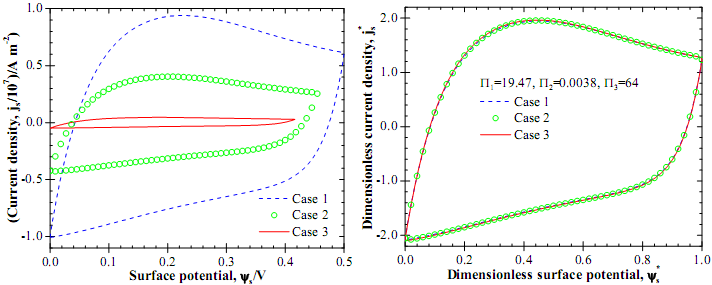
Fig.2. Predicted (a) jsversus ψs curves and (b) j*sversus ψs* curves for three cases with different parameters.
Figure 3a shows the predicted js-ψs curves from CV simulations for three values of potential window, i.e., Δψ =0.3, 0.4, and 0.5 V. Results were obtained by solving the MPNP model with a Stern without the electrode (Le=0 nm). It is evident that j*s reached the maximum value at about ψs=0.2 V for all three curves and then decreased for larger surface potential. Thus, a hump was observed around ψs =0.2 V typical of experimental cyclic voltammetry measurements.
To physically interpret the observed hump in js-ψs curves, Figure 3b shows the corresponding anion concentration c2 at the electrode surface x=0 nm as a function of surface potential for the same cases considered in Figure 3a. The maximum ion concentration cm=1/NAa3 due to finite ion size was also plotted in Figure 3b. It is evident that the surface anion concentration c2(x,t) increased rapidly with increasing potential up to ψs =0.2 V. This regime corresponded to the increase of current density js shown in Figure 3b where it reached a maximum at ψs =0.2 V corresponding to the crest of the hump. For ψs >0.2 V, the anion concentration asymptotically approached its maximum value cm. Then, the ion accumulation near the electrode surface became slower as the electric potential increased. This, in turn, resulted in the decrease in the current density js (Figure 3a). Overall, these results demonstrate that the hump observed experimentally in CV curves for EDLCs can be attributed to the saturation of ion concentration at the electrode surface.
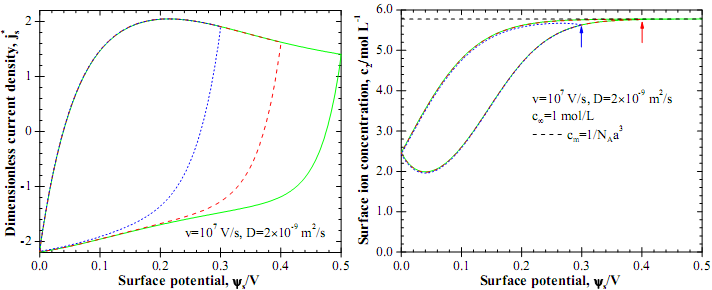
Fig. 3. Predicted (a) j*s versus ψ s curves and (b) c2(x=0) versus ψs curves determined from CV simulations for three values of potential window, i.e., ψmax-ψmin =0.3, 0.4, and 0.5 V.
- Four dimensionless numbers were identified to govern the electron and ion transport in the charging dynamics of electric double layers for planar electrode during CV measurements, namely
![]()
- For electrodes with large radius of curvature, the hump observed in CV curves was due to the saturation of ion concentration at the electrode surface as the electric potential increased.
- The predicted EDL capacitance from CV simulations was constant and equal to the capacitance under equilibrium conditions for dimensionless scan rate Π3 <1%. The critical Π3 increased with increasing electrode electrical conductivity.
- The electrode had no effect on the EDL capacitance measured at scan rates smaller than a critical value.
H. Wang and L. Pilon, 2012. Physical Interpretation of Cyclic Voltammetry for Measuring Electric Double Layer Capacitances, Electrochimica Acta, Vol. 64, pp.130-139. doi 10.1016/j.electacta.2011.12.118 pdf